Trace exports for eval must be reproducible
Reproducible trace exports for eval without unnecessary volume: filters for cost, latency, errors, and scenarios, plus a selection manifest and trace_id validation.
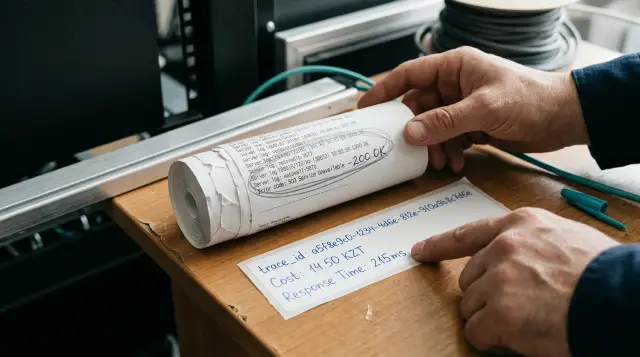
Trace exports for eval must be reproducible. If an analyst selects slow and expensive requests today, but an engineer cannot retrieve the same set of trace_id values tomorrow, this is not an evaluation dataset. It is a one-off collection that cannot be trusted when comparing models, prompts, and routes.
The problem rarely lies in the CSV or Parquet format. Usually, the team mixes three different operations: defining the target population, extracting trace content, and preparing examples for a run. Then the cost filter suddenly counts retry costs twice, latency means model time in one place and the entire chain in another, and an export after masking loses some rows without an explicit report.
You need a selection contract. It defines which completed user traces belong in eval, which fields explain the selection, and how to verify that the export did not substitute a different set. This contract looks boring right up until the first argument about why a new model performed "better" on a different dataset.
The unit of selection should be the user trace
For eval, select a completed root trace that corresponds to one user intent or one background task run. Do not select model calls, searches, database operations, or tool calls as independent examples.
A single LLM task almost always leaves a tree: an incoming HTTP request, classification, retrieval, one or more model calls, tool calls, retries, post-processing, and response delivery. If you take child spans, one failed task becomes five rows. The dataset becomes skewed toward technically complex requests, and the evaluator starts measuring the quality of individual fragments instead of the result the user saw.
In OpenTelemetry, a trace describes the path of a request, while a span describes one operation. A span has a trace identifier, parent, timestamps, attributes, events, and status. That provides enough data to build a selection from the root of the tree rather than from a random node.
Add a minimal set of task-level fields to the root span:
app.scenario, such assupport_rag,document_extract, oragent_action;app.request_id, if it already exists in the application layer;gen_ai.operation.nameor your own operation field;app.eval.eligible, if some requests should not be used for evaluation;- an application or prompt version identifier, but not as a substitute for the scenario type.
Do not put the model name, provider, or a specific route URL in app.scenario. The scenario answers what the user was trying to do. The model and route answer how the system did it. Mix them together and, after changing the model, you will lose the ability to compare old and new data within one scenario.
Another common mistake is forcing asynchronous work to remain part of the HTTP trace. If a queue starts the handler later, create a separate trace and link it to the original with a span link or application-level request_id. The HTTP request duration and background processing time then do not pretend to be one latency value.
Describe the filter as an immutable contract
A filter is not UI state in an observability system. It is a versioned object. It should have a name, time interval, inclusion rules, exclusion rules, schema version, and an order for calculating derived fields.
It is enough to store the contract in YAML next to the eval code or in a configuration table. The important thing is that the filter can be read, executed, and checked without guessing which interface switches were enabled.
selection_id: eval-support-rag-slow-errors-v3
source_window:
  started_at_gte: "2026-06-01T00:00:00Z"
  started_at_lt: "2026-06-08T00:00:00Z"
unit: root_trace
where:
  scenario_in:
    - support_rag
  completed: true
  environment: production
  latency_ms_gte: 8000
  total_cost_usd_gte: 0.02
  outcome_in:
    - success
    - terminal_error
exclude:
  - synthetic_traffic
  - deleted_user_data
  - missing_root_input
pricing_version: provider-rates-2026-06-01
schema_version: trace-eval-v2
This file does two things. It separates the intent of the selection from the SQL implementation, and it prevents someone from quietly extending the period, changing a threshold, or adding error types halfway through an experiment.
Avoid vague descriptions such as "expensive traces" or "problematic responses." Every boundary needs a unit and an inclusion rule. latency_ms_gte: 8000 means latency of at least 8,000 milliseconds. "About eight seconds" means nothing when one request appears in one export but not in the next run.
Record the time boundary separately. Use a half-open range [started_at_gte, started_at_lt), not "from June 1 through June 7 inclusive." A half-open range does not duplicate records when you join weekly exports, and it does not depend on how a particular system interprets the end of a day.
Cost must belong to the entire trace
A cost filter is useful when it answers how much money was spent on a user task. The price of one model span answers a narrower question: how much one call cost. These numbers must not be substituted for each other.
Calculate total_cost at the trace level as the sum of actually executed calls belonging to one task. If the system performed retrieval, called an inexpensive routing model, then the main model, and retried after a timeout, the user trace includes the cost of all those actions. Otherwise, the most painful cases disappear from the filter precisely because you split them into pieces.
But do not add up the cost of every technical span. The same call may appear as an HTTP client span, an SDK span, and a custom wrapper span. You need one canonical accounting layer, usually an application span that knows the model call ID, input and output tokens, currency, and billing status. Keep the other spans for diagnosis.
A practical field layout looks like this:
{
  "trace_id": "9df1...a02c",
  "app.scenario": "support_rag",
  "usage.input_tokens": 1842,
  "usage.output_tokens": 516,
  "cost.amount": 0.02384,
  "cost.currency": "USD",
  "cost.pricing_version": "provider-rates-2026-06-01",
  "billing.call_id": "call_01J..."
}
Sum only unique billing.call_id values. If there is no identifier, fix the instrumentation first. Deduplicating by the combination of time, model, and token count can sometimes rescue old data, but it is not reliable accounting: two identical requests can happen in the same millisecond.
Zero cost also needs an explanation. It may mean a local open-weight model, a cached response, a test route, or simply a missing field. Do not mix these meanings. Add cost.accounting_state: billed, estimated, cached, local, unknown. A monetary threshold should include only billed and, if the team allows it, estimated. unknown must not silently pass as zero.
AI Router can provide one OpenAI-compatible path to different providers, but cost aggregation rules still belong to your application and your selection contract. Routing does not remove the need to record the pricing version and the identifier of every billed call.
Latency without a boundary measures a random fragment
For product eval, trace latency is the time from the start of the root user request to the final result or terminal failure. This is the number users rely on when deciding whether the system is slow.
Within one trace, it is useful to store several other durations: model_latency_ms, retrieval_latency_ms, tool_latency_ms, and queue_wait_ms. They explain the cause, but they do not replace end_to_end_latency_ms.
The calculation rule must handle retries. Suppose a request started at 10:00:00, search took 300 ms, the first model call timed out after 4,000 ms, the second returned an answer after 3,500 ms, and post-processing took 200 ms. The user waited about 8,000 ms, not 3,500 ms. The export should include total latency, the number of attempts, and the maximum duration of one model call. Then you can evaluate slow responses separately and determine whether the delay came from the model, the network, or a retry.
Do not automatically exclude cancelled requests. A user cancellation after 20 seconds is often more important than an ordinary error. Mark it as a separate cancelled outcome, preserve the observed duration, and decide in the contract whether this class belongs in the current eval. Cancellations should not be mixed with successful responses, but they should not be discarded out of habit either.
OpenTelemetry recommends making the sampling decision at the start of a trace and propagating it downstream. This is useful for production telemetry, but it does not solve the eval selection problem: head sampling may discard a rare expensive error before you know its cost and latency.
For that reason, retain a compact summary record for the root trace even where the full body and all child spans are collected selectively. This record only needs trace_id, scenario, outcome, duration, token counts, cost, application version, and an indicator showing whether the useful payload is available. Full prompts and responses can be fetched later, but only for an approved list of trace_id values.
A telemetry error and a bad response are not the same thing
A technical error means that an operation ended with a protocol error, exception, or known dependency failure. A bad response can arrive with a success status: the model confidently invented a fact, retrieval failed to find the required document, an agent called the wrong tool, or an extractor skipped a field.
Store these classes separately. For a root trace, I usually use outcome with the values success, terminal_error, cancelled, policy_blocked, and partial. I add quality_signal separately when it has already been provided by a user, an automated checker, or a human labeler. Do not treat the absence of a quality signal as evidence of a good response.
OpenTelemetry documentation on recording errors notes that not every status code means the same thing. HTTP 404 may be a problem if the application expected a resource, and a normal result if it was checking whether the resource existed. It also advises against recording an operation as an error when the failure was handled and the system completed normally.
For an LLM application, the consequences are straightforward. An error on the first model call, followed by a fallback that gave the user a correct answer, should not turn the root trace into terminal_error. Keep the attempt event and retry_count, but leave the root outcome as success. Otherwise, the "error" sample will contain requests that users received normally.
At the same time, do not set the root to OK simply because the HTTP response returned status 200. If the API returned a structured response with finish_reason=error, an agent exhausted its step limit, or your validator rejected the result, that is an application-level failure. It deserves its own outcome, even when the transport worked perfectly.
The error.type field is more useful than free text because it can be grouped consistently. OpenTelemetry recommends setting it when an operation ends in error, while status details should not contain sensitive data. Do not use raw exception messages in filters: they often contain PII, URLs, request fragments, and too many variations.
Do not infer the scenario type from the model name
The scenario type provides the context in which the evaluator interprets the input and output. "Answering from an internal knowledge base" requires checking whether the answer is grounded in context. "Extracting document details" requires checking field structure, completeness, and accuracy. "Calling an action" requires checking the selected tool, arguments, and side effects.
If you export all traces from one product endpoint without a scenario, the dataset quickly becomes unusable. Short classifications will outnumber long retrieval-based answers. Simple tasks will create the impression that the model works well even though the expensive agent often fails. One average score on such a dataset tells the CTO little and tells the team responsible for fixing the system almost nothing.
Set the scenario when entering the application workflow rather than reconstructing it afterward from the span name. Span names should describe a statistically meaningful class of operation, not an individual instance with high-cardinality parameters. This matches OpenTelemetry's recommendation to use a generalized, human-readable operation for the name.
If one request passes through several scenarios, choose a primary scenario for selection and record the others as an array. Do not create two copies of the trace in one export. You can still build separate views using secondary labels, but the manifest must clearly state which label determines membership.
A useful minimum for each scenario includes:
- a definition of the expected result;
- required input fields and permitted masks;
- the evaluation method, automated or manual;
- expected failure classes;
- a rule for which tool calls and retrieval context must be preserved.
This specification prevents another expensive mistake: the team exports a polished dataset but cannot explain to a labeler what should count as a correct answer.
Select identifiers first, then extract content
A two-phase export reduces volume and makes the dataset membership verifiable. In the first phase, build a compact candidate table with one row per root trace. In the second, fetch the payload only for the approved list of trace_id values.
The first phase should not read full prompts, completions, retrieval documents, or stack traces. It should use indexed columns: time, scenario, environment, total latency, total cost, outcome, and whether the required content is available.
WITH selected AS (
  SELECT
    trace_id,
    app_scenario,
    started_at,
    end_to_end_latency_ms,
    total_cost_usd,
    outcome,
    retry_count
  FROM trace_roots
  WHERE started_at >= TIMESTAMP '2026-06-01 00:00:00+00'
    AND started_at < TIMESTAMP '2026-06-08 00:00:00+00'
    AND environment = 'production'
    AND completed = TRUE
    AND app_scenario = 'support_rag'
    AND end_to_end_latency_ms >= 8000
    AND total_cost_usd >= 0.02
    AND outcome IN ('success', 'terminal_error')
    AND synthetic_traffic = FALSE
    AND root_input_available = TRUE
)
SELECT * FROM selected;
The result of this operation becomes the selection registry. Save it as an immutable file or table with a selection_id. From that point on, the second phase may only join by trace_id to payload, model-call, and retrieval tables. It must not reapply the time range, cost threshold, or outcome filter on its own.
This is where silent data loss often appears. For example, an export job uses an inner join with the prompt table. Traces whose prompts were deleted under a retention policy disappear. The analyst gets a "ready dataset," but it is no longer the dataset that passed the filter. The correct behavior is a left join, an explicit payload_state=missing_or_redacted field, and a separate report explaining incompleteness.
Payloads must be masked before being sent to labelers or an external evaluator. This applies to more than names and phone numbers. In an LLM context, PII often hides in free text, tool JSON, URLs, file names, and error messages. Keep the original data in a controlled environment, and put masked fields and the masking-rule version in the export record.
Selection validation must catch row substitution
Checking that "the CSV has as many rows as the query returned" is too weak. It will not notice that one trace_id disappeared and another was added, that a duplicate displaced a unique trace, or that the job exported data from a neighboring time window.
After the first phase, create a selection manifest. Every export needs one, even if you produce it manually once a month.
{
  "selection_id": "eval-support-rag-slow-errors-v3",
  "schema_version": "trace-eval-v2",
  "source_window": {
    "started_at_gte": "2026-06-01T00:00:00Z",
    "started_at_lt": "2026-06-08T00:00:00Z"
  },
  "trace_count": 184,
  "unique_trace_count": 184,
  "trace_id_sha256": "sha256(sorted trace_id values)",
  "filter_sha256": "sha256(canonical selection yaml)",
  "pricing_version": "provider-rates-2026-06-01",
  "payload_policy_version": "redaction-v4"
}
Calculate trace_id_sha256 from the sorted identifier list using an unambiguous line separator. Do not hash the entire export JSON: field order, time formatting, and text masking may change even when the selection itself remains the same.
After the second phase, compare four values:
- the number of rows in the registry and in the export record;
- the number of unique
trace_idvalues; - the checksum of the sorted
trace_idlist; - the distribution of reasons for incomplete payloads.
The first three should match. The fourth does not have to be zero, but it must be explicit. If five traces lost context after redaction, that is not a reason to silently delete five rows. It is a reason to decide whether the specific eval permits an incomplete example and record that decision in a new contract.
Add an idempotency test. Run the export twice against the same source snapshot and compare the manifests. If the identifier hash changes, the cause is almost always a floating now(), a nondeterministic limit without ORDER BY, an updated pricing table, or a join that multiplies rows.
Random sampling after filtering requires stratification
After applying strict thresholds, you often have too many traces for manual review. Simple random sampling looks fair, but it almost always overrepresents the most common request type. It does not guarantee the presence of terminal errors, expensive retries, long contexts, or rare scenarios.
Stratify the registry after filtering. The strata should reflect the reasons you want to make a technical decision: outcome, cost range, latency range, scenario, fallback presence, language category, or tool type. Do not create dozens of intersections. If a stratum contains one example, you have built a collection of exceptions rather than a sampling plan.
For each row, add a deterministic random number derived from trace_id and a fixed seed. Then select the required number of rows within each stratum using that number. On a repeat run, the same seed will produce the same set, while a new seed will produce a different set without a hidden dependency on storage order.
Record sampling_method, sampling_seed, and stratum quotas in the manifest. Keep the full candidate registry separately. This lets the team answer two different questions: "which traces met the conditions?" and "which of them entered the manual eval?" These are not the same entity.
Test the export as part of the eval pipeline
Trace exports fail for more than bad SQL. They fail because of new schema versions, renamed attributes, changed redaction, late-arriving spans, new outcome types, and a developer replacing a left join with an inner join for the sake of "clean data."
Put checks in CI or in the orchestrator job. They do not require the full production database. A small fixture set is enough if it includes an ordinary success, an expensive retry, a terminal error, a cancellation, missing payload, and two traces with the same token count.
The pipeline must confirm that:
- the filter selects only completed root traces;
- retries collapse into one trace and do not duplicate cost;
unknowndoes not enter a monetary threshold as zero;- the full export retains every registry
trace_id, even when content is missing; - a repeat run against the same snapshot produces the same manifest hash.
Do not replace these tests with volume monitoring. The metric "we exported as many rows today as yesterday" will not catch a change in composition. In a good system, the export publishes its own manifest, a stratum diff, and a report on incomplete payloads.
If your team uses AI Router to access different models, separate the scenario, actually selected model, and calculated cost fields especially carefully. Otherwise, a route change will look like a quality change even though you compared different classes of requests.
Start with a compact registry of root traces and learn to reproduce its hash. After that, CSV, Parquet, labelers, and automated judges become ordinary engineering work. Until then, they only give a random collection a convincing appearance.
Frequently asked questions
What should count as one record when exporting traces for eval?
For eval, export completed user traces with one stable root identifier, not individual spans. Otherwise, one request turns into dozens of technical operations, and an expensive generation looks like many separate examples.
Can traces be filtered by cost when model prices change?
Yes, as long as the cost is calculated using the same pricing version and token accounting rules. The manifest should record the currency, formula, pricing version, and calculation time. Otherwise, the cost filter cannot be reproduced a week later.
Should retries be included in the eval sample?
No. Collapse retries into one user scenario, but retain their count, causes, and total cost as trace fields. If every attempt is exported separately, the evaluation will overstate the error rate and charge one incident several times.
What is the right way to measure latency for an LLM scenario?
Usually not. The metric that matters for user experience measures the time from the start of the root request to the final result, including required tool calls and retries. The duration of one model call is useful for diagnosis, but it does not replace end-to-end latency.
Does every Error status mean the trace should be exported?
Not always. OpenTelemetry explicitly supports contextual classification. For example, HTTP 404 can be an error or the expected result of checking whether a resource exists. For eval, separate infrastructure and policy errors from expected business responses, or the filter will collect a meaningless mix.
How can you reduce export volume without losing important examples?
First export only metadata, identifiers, hashes, and the fields needed for filtering. Fetch full prompts, responses, and documents only for traces that have already been selected, after masking PII and checking access permissions.
How can you prove that the export did not change the selected sample?
You need at least three checks: the row count, the set of trace_id values, and a checksum of the sorted identifier list. Comparing row counts catches only obvious errors, while the list hash detects one trace being replaced by another.
How should the scenario type be set in an LLM application trace?
The scenario should describe the user's task, not the model name or HTTP route. Examples include "answering from a knowledge base with search" and "extracting fields from a document." This label remains useful when you change the model, provider, or tool schema.
Can SQL or ETL be used to export an eval dataset?
Yes, but the layer must run after the trace_id set has been defined, rather than selecting data on its own. Its job is to export fields and content for an approved list, not silently apply a second version of the filter.
Should traces be stratified before eval?
Do not send traces to eval without grouping them by selection rationale. Check ordinary successful requests, slow successful requests, errors, expensive requests, and rare scenarios separately. Otherwise, a large class of cheap, typical requests will hide regressions where the product loses money or users.