MoE Expert Parallelism Requires Measurement Before Launch
MoE expert parallelism before launch: how to check expert skew, all-to-all, memory, capacity factor, and p99 under real workloads.
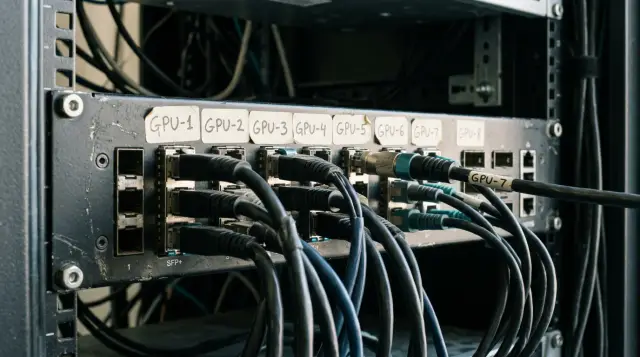
MoE expert parallelism requires measurement before launch. It does not fix poor routing or turn a weak inter-node network into a fast one. It moves expert weights and computation across more GPUs, and it also moves tokens across rank boundaries. If you measure only average throughput, your team will almost certainly miss the problem.
A bad launch usually looks the same: the model fits in memory, the demo run succeeds, and then production traffic changes request lengths and batch composition. One or more experts receive a tail of extra tokens, one node becomes saturated with communication, p99 rises, and an attempt to increase the capacity factor ends in an OOM. This is not a rare edge case. It is the usual result when a team checks the number of experts before launch but not the path taken by every token.
By expert parallelism, I mean a setup where MoE-layer experts are distributed across GPUs in an EP group. The dense parts of the transformer run under their own parallelism scheme, while the router assigns each token to one or more experts. The system performs dispatch, runs the expert MLPs, and performs combine. All three operations matter for the budget, not just the MLP FLOPs.
First, define the workload unit
Measuring MoE by request count is meaningless. The router sees tokens in a specific layer and a specific batch, so the workload unit must include at least the number of active tokens, sequence length, batch size, top-k, and whether the request is in prefill or decode mode.
For training, active tokens can usually be expressed as:
T = micro_batch_size × sequence_length × число непустых позиций
For inference, that is not enough. Prefill can bring thousands of tokens in one pass, while decode often produces one new token per sequence. The average batch size calculated over a minute mixes two different modes. One measurement on a "typical request" says nothing about whether the system can handle a short interactive decode after a long prefill.
Build at least four profiles:
- a short decode with the number of concurrent sequences you promise users;
- a normal production prefill with a realistic length distribution;
- a long prefill close to the permitted context length;
- a stressful mixed batch containing both new short requests and long ongoing conversations.
Do not replace this set with a synthetic batch of identical sequences. Equal lengths are useful for an initial kernel check, but they smooth out message-size variation and hide queues. A launch decision needs at least one replay of sanitized production requests, or a dataset that preserves the distribution of lengths, languages, document types, and tool calls.
Define separately what counts as a successful request. If the engine drops tokens when an expert overflows, a fast response is not necessarily a good response. The report should place latency, token drop rate, and quality on a fixed evaluation set side by side. These metrics cannot be separated.
Average expert load proves almost nothing
Expert balance is assessed from the distribution of assignments, not from an attractive average token count per expert. Suppose a layer has E experts and, after top-k routing, expert e receives n_e tokens. The average is μ = Σn_e / E. This is enough only to understand the scale. Risk lives in the upper part of the distribution.
For each MoE layer, I usually require these fields:
{
  "layer": 17,
  "active_tokens": 8192,
  "top_k": 2,
  "tokens_per_expert": [911, 844, 1003, 771],
  "expert_p50": 846,
  "expert_p95": 995,
  "expert_max": 1003,
  "expert_max_to_mean": 1.14,
  "top_5_percent_expert_share": 0.09,
  "dropped_tokens": 0
}
The array does not have to be stored for every request in a real log. You can aggregate it into time-window histograms. But p95, p99, max/mean, and the traffic share of hot experts must be available for every layer. Global model statistics hide the layer that determines the p99 of the entire request.
A simple boundary is useful for an initial review: if max/mean is noticeably above one on a stable profile, you already have imbalance. How acceptable it is depends on capacity, batch size, and memory headroom. There is no universal threshold. What matters is that maximum load does not regularly hit capacity and that the pattern does not change sharply between traffic samples.
Do not confuse two mechanisms. Auxiliary loss, jitter, stochastic routing, and similar techniques try to make router training less skewed. They do not guarantee even distribution on a specific production batch. After fine-tuning or a domain change, the distribution can shift even when the training log looked healthy. That is why both a post-training control-set measurement and live-traffic monitoring are needed.
DeepSpeed MoE documentation returns exp_counts together with the layer output and auxiliary loss. This is the right starting point, but not the final metric. The assignment counter tells you who received the tokens. It does not tell you how long an expert waited for data, how long its MLP took, or where a queue formed.
Experts and GPUs can be balanced differently
The router can distribute tokens evenly among experts and still overload one GPU. This happens when several popular experts are placed on one rank, when expert placement does not match the network topology, or when different experts have different compute costs.
Track two matrices. The first, expert_load[layer, expert], shows expert assignments. The second, rank_load[layer, rank], sums assignments for all experts owned by a rank. For an inter-node deployment, add a third, node_load[layer, node]. It reveals a problem that a GPU chart often makes less obvious.
Imagine 64 experts on eight GPUs. Every expert receives roughly the same number of tokens, but experts 0-7 are on one node, and routing for a particular domain selects them more often. The imbalance within each expert may be moderate. Across nodes, it is already serious: the other nodes send more activations to one destination, and the combine result returns along the same path.
For every layer, check:
- the share of local assignments, where the token and expert are already on the same rank;
- bytes sent and received by each rank;
- p50 and p99 message size between rank pairs;
- the difference between the busiest rank and the average rank;
- the share of traffic crossing a node boundary.
Many teams look only at total all-to-all bytes. That is a late metric. All-to-all with the same total volume can behave very differently: one version consists of reasonably large, even transfers, while another relies on small messages and several overloaded receivers. The second case is especially common in decode.
Do not place experts by simply laying them out in order and forgetting about them. First measure which experts are selected together and which request groups their tokens come from. Then test several placements on the same data. If the framework does not provide sufficiently fine-grained placement control, at least make sure the EP group follows a fast domain boundary in your infrastructure instead of accidentally crossing a slow inter-node link.
Profile all-to-all separately from computation
In MoE, a token passes through communication twice: first dispatch to the expert owner, then combine back to the original rank. The time of an MoE layer therefore cannot be charged entirely to GEMM. At a minimum, mark router, packing or permutation, dispatch, expert compute, combine, and unpacking.
A minimal record for one layer might look like this:
{
  "layer": 17,
  "router_ms": 0.08,
  "pack_ms": 0.21,
  "dispatch_ms": 1.74,
  "expert_compute_ms": 1.12,
  "combine_ms": 1.58,
  "unpack_ms": 0.18,
  "remote_token_fraction": 0.76,
  "cross_node_bytes": 67108864
}
Synchronize the measurement correctly. If you take time on the CPU around an asynchronous GPU call without CUDA events or explicit synchronization, you are measuring queue submission. If you synchronize after every small operation, you are destroying communication-computation overlap yourself. The profile must show both the duration of individual sections and the layer's critical path.
Megatron Core documentation explicitly names three performance walls for MoE: memory, communication, and compute efficiency. This is useful because it prevents treating everything with one setting. Increasing EP may free memory but increase communication. Grouped GEMM may reduce compute time but will not fix skewed dispatch. More aggressive quantization may ease memory pressure but will not reduce the number of small network operations.
Run two control tests. The first uses the same model with local experts, if the implementation supports EP=1. The second uses the target EP configuration. The difference is not purely the "network cost," because GEMM shapes and memory layout also change, but it quickly shows whether further tuning is worthwhile. DeepSpeed AutoEP documentation explicitly states that expert parallel size 1 keeps experts local and is suitable for testing without AllToAll.
If EP=1 is faster and fits in memory, there is no reason to distribute experts for its own sake. If EP=1 does not fit, you do not need an argument about whether the network is necessary. You need an exact budget for its cost.
Capacity factor changes quality, memory, and the latency tail
The capacity factor sets the limit on tokens an expert can accept in one pass. Roughly, for top-1, expert capacity is calculated as the average number of tokens per expert multiplied by the capacity factor. The exact formula and rounding depend on the engine, so read the code or documentation for your implementation before launch.
This setting has an unpleasant property: it looks like a pure performance parameter, but it can change the model's output. With limited capacity, overflowed tokens are dropped, reassigned, or sent through another path, depending on the implementation. In DeepSpeed documentation, drop_tokens=false effectively means unlimited capacity. Megatron Core documentation describes both a no-drop mode and a capacity-limited mode in which overflowed tokens are dropped before communication between EP ranks.
These modes are not interchangeable.
The no-drop mode preserves work for all assigned tokens, but allows large dynamic buffers and a long tail on hot experts. Limited capacity fixes an upper bound for computation and part of memory use, but introduces the risk of losing tokens. Padding to capacity adds another trade-off: regular shapes are more convenient for some kernels, but you pay for empty positions.
Test the capacity factor as a series of runs, not with one average figure. For each workload profile, record:
- token drop rate by layer and for top-1 and top-2 routing;
- peak allocated and peak reserved memory on every GPU;
- p50, p95, and p99 MoE-layer time;
- quality changes on a set that reflects your model's answers;
- the max/mean ratio of expert load.
The popular advice to "raise the factor and the problem will disappear" is wrong. The problem often disappears in the drop-rate metric and returns as memory headroom and p99. A high factor is justified when memory headroom is confirmed on long prefill and skew is rare. It does not replace fixing the router or expert placement.
Do not use one capacity factor for training and serving without a separate check. Training includes a backward pass and optimizer state. Serving has a different batch shape and stricter latency-tail requirements. DeepSpeed sets capacity_factor and eval_capacity_factor separately, and the existence of these two parameters shows that the modes should not be merged into one.
Calculate memory by phase, not by active-parameter count
The statement "only two experts are active per token" is useful for estimating computation but dangerous for estimating memory. A GPU holds dense weights, local expert weights, the KV cache during inference, activations, dispatch buffers, temporary permutation tensors, and communication buffers. Training also adds gradients and optimizer states.
For every rank, record peaks separately at four points: before entering the MoE layer, after packing, after dispatch, and after expert compute. If the peak appears after dispatch, reducing the number of layers or moving some dense weights will not fix the cause. If it appears during expert compute, inspect local expert load, grouped matrix-operation size, and activation format.
This calculation sheet is useful even when the numbers come from a profiler:
rank memory = persistent weights
            + KV cache or training states
            + dense-part activations
            + dispatch and combine buffers
            + temporary MoE tensors
            + allocator reserve
Do not put "allocator reserve" into an unexplained safety margin. It often explains why a load test passes on a clean process and fails an hour later. A long run alternating short and long requests is needed to observe fragmentation and peak-memory stabilization.
Tensor parallelism inside experts is not free either. It can help when an expert MLP does not fit or its matrices are large enough, but splitting small expert matrices adds communication and worsens the computation shape. Megatron Core requires sequence parallelism when TP and EP are combined. This is not a decorative flag: without coordinated sequence partitioning, you get extra memory use or incorrect activation exchange.
Top-2 does not protect against hot experts
Top-2 routing is often treated as built-in protection: if the first expert overflows, the second will take the work. In practice, the second route also has a distribution, capacity, and network cost. Measure it separately.
Collect three counters: the share of tokens for which the second choice differs from the first, the assignment distribution for the second choice, and the share of second assignments that never reach computation. If the second choice repeatedly selects the same popular expert group, it merely doubles the pressure on that group. If it is almost always remote, it can increase network traffic more than the team expects from the number of active experts.
DeepSpeed MoE has a top2_2nd_expert_sampling parameter that controls second-expert sampling for top-2. Do not enable or disable such mechanisms based on someone else's configuration. Compare them on the same request set by quality, rank skew, drop rate, and tail latency. An improvement in one metric and a decline in another does not answer the question until you know which metric limits your service.
There is another distinction that is often blurred: router imbalance and execution imbalance. The router may produce almost equal assignments, while the scheduler or kernels handle small expert groups poorly. Conversely, a good grouped GEMM cannot save a router that sends half the batch to one expert. First inspect assignment counters, then computation time for expert groups. Do not change both layers at once, or you will not know what produced the result.
Intentionally test degradation under uneven traffic
A uniform synthetic workload answers whether the configuration works under ideal conditions. A launch requires a different answer: how much worse will the service become when the router sees a skewed token stream?
Create a reproducible test with several request classes. For example, divide production traffic into technical documents, short questions, long-history conversations, and tool-using requests. Run the classes separately, then mix them in the same proportions as the real queue. If you do not have production traffic, build the set by properties rather than topics: length, language, share of special tokens, structured-text density, and number of tool calls.
Next, you need a degradation curve, not one throughput number. Increase concurrency in steps and record p99 end-to-end latency, p99 MoE-layer time, maximum rank load, remote token fraction, drop rate, and peak memory at each step. The point where p99 rises while average throughput barely changes matters more than the highest attractive throughput. That is where the queue starts hiding imbalance.
A good test intentionally creates an unfavorable window: long prefills running alongside decode, requests of different lengths, and periodic concurrency spikes. You do not need to declare the model unfit because it is slower in the worst case. You need to know the size of the degradation, its cause, and the limit you will set for users.
An API-level rate limit helps hold that limit, but it does not replace profiling. AI Router can apply key-level rate limits and provide audit logs, making it convenient in production to connect MoE degradation with a specific traffic class without retaining unnecessary personal data. This is useful after launch, but the initial workload boundaries still have to be defined in advance.
The readiness checklist must end with a decision
Before launch, the team should have a short list with answers, not a folder full of profiles. If the answer to any question is "we do not know," the configuration is not ready for the stated workload.
- Which four workload shapes did we test, and how do they resemble real requests?
- Which MoE layer has the highest expert skew, rank skew, and p99 time?
- What share of tokens crosses node boundaries, and which pair of nodes exchanges the most data?
- What happens to quality and drop rate at the selected capacity factor?
- How much memory remains on each GPU during a long mixed run?
Add an explicit decision: allowed concurrency, allowed input length, batch limit, capacity policy, and the action to take when p99 rises. "We will monitor it" is not an action. You need a concrete switch: reduce admission, lower the batch size, route some traffic to another model, disable a risky routing mode, or roll back the configuration.
Expert parallelism pays off when it gives the model the required capacity without an unpredictable tail. First prove this using token distribution, all-to-all time, memory on every rank, and quality under overload. After that, EP-group size stops being a guess and becomes a parameter the team can take responsibility for.
Frequently asked questions
What is expert parallelism in MoE?
Expert parallelism places different MoE-layer experts on different GPUs. The router sends tokens to the GPU that owns the selected expert, and the system then returns the results. This reduces the expert-weight memory used on each GPU but adds all-to-all communication.
Does expert parallelism speed up MoE inference?
Not always. When there are few active tokens per step and experts are spread across nodes, communication latency can erase the benefit of sparse computation. First compare EP=1 with the distributed setup using the same batch shapes, sequence lengths, and top-k values.
Which metrics best show router imbalance?
For every MoE layer, collect dispatched tokens for each expert and separately for each rank. Average load hides hot experts, so inspect p50, p95, p99, the maximum, and the max/mean ratio. It is also useful to record the percentage of tokens sent to the busiest 5% of experts.
Why does MoE run out of memory when only a few experts are active per token?
The selected experts' weights are not the only source of memory use. GPUs also hold dispatch and combine buffers, activations, temporary tensors for token permutation, dense-layer parameters, and, during training, optimizer states. Measure peak memory inside the MoE block, or the overall process maximum will not reveal the cause of the OOM.
What does the capacity factor do in MoE?
The capacity factor limits how many tokens one expert accepts in a particular MoE layer. A low value reduces buffers and may lower runtime, but when an expert overflows, tokens may be dropped or handled by other framework logic. The same setting can have different consequences in training and inference, so test them separately.
How is expert balance different from GPU balance?
No. Expert balance asks how evenly the router distributes work among experts. Rank balance asks whether the group of experts placed on one GPU or node receives a disproportionate share of traffic. The first imbalance hurts training and capacity, while the second undermines network scaling.
Do you need to measure the second choice separately in top-2 routing?
It matters when top-k is greater than one or the router actually selects a second route. Measure the share of tokens whose second expert differs from the first, the distribution of second-choice assignments, and the share of the second route lost because of capacity. If the second route almost always goes to the same hot experts, top-2 does not solve the imbalance.
How can you tell a network bottleneck from slow expert kernels?
First separate network issues from kernel issues. If all-to-all time grows with the number of remote tokens and rank skew, inspect topology and expert placement. If communication stays stable while compute grows with a similar token count, check grouped GEMM sizes, quantization, matrix shapes, and the tail of the busiest experts.
Can tensor parallelism and expert parallelism be combined?
You can, if the model and execution graph support the combination. Megatron Core documentation requires sequence parallelism when tensor parallelism and expert parallelism are used together. Omitting it often appears as unexplained memory growth or incorrectly assembled activations rather than an obvious configuration error.
Why do prefill and decode require different MoE tests?
For short decode, one token or a small batch creates small transfers, making the fixed cost of communication more visible than expert computation. Prefill has more tokens, but dispatch buffers grow and the risk of hot experts increases. The two modes cannot be evaluated using one average tokens-per-second figure.