How to measure p95 latency in an LLM API
Learn how to measure p95 latency in an LLM API across the network, gateway, GPU queue, and generation with k6, OpenTelemetry, and traces.
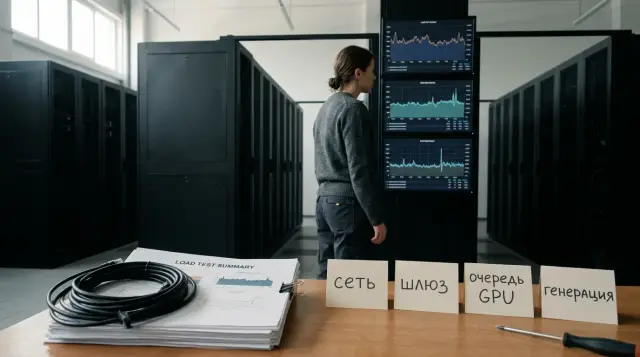
A single slow generation has at least four possible owners: the network, the API gateway, the queue in front of the GPU, and the model itself. If you look only at http_req_duration, they all collapse into one p95, and the team starts arguing from intuition. Network engineers blame inference, ML engineers blame the proxy, and the chart cannot settle the argument.
A useful measurement combines two observations of the same request. k6 records time from the outside, while OpenTelemetry spans record work inside the server. A shared trace ID connects them. You must subtract durations, not absolute timestamps: the clocks on the load generator and server are almost never synchronized well enough to analyze tens of milliseconds.
One p95 hides four different delays
Break the request down before running the test, or you will fit phase names to a chart you have already seen. For a regular HTTP response, client time can be expressed like this:
client_total = client_transport + gateway + gpu_queue + generation + response_transfer
server_total = gateway + gpu_queue + generation
network_envelope ≈ client_total - server_total
client_transport includes waiting for a free client connection, DNS, TCP, TLS, and sending the request body. gateway includes authentication, rate limiting, data masking, route selection, request conversion, and the provider call. gpu_queue starts when the request is ready to run but no compute slot is available. generation starts when inference actually begins and ends with the last token or cancellation.
The final line of the formula is deliberately called the network envelope. The difference includes the round trip, load balancers outside the server root span, response transfer, and small client costs. It is not pure RTT. If the team calls the difference "the network," it will eventually try to fix the connection even though response compression after the span closes is adding the delay.
A streaming response needs two measurements. Time to first byte, which for an LLM is usually close to time to first token, tells you how quickly the system responds. Full duration tells you when the user received the complete result. The same request can have a normal TTFT and slow generation, or a poor TTFT and fast subsequent tokens. Those cases do not belong in one SLO.
Keep the application queue separate from the GPU queue. Waiting in an HTTP connection pool, gateway semaphore, or broker belongs to the component holding the request. GPU queue time starts only after the inference scheduler accepts the work. This distinction determines who owns the incident and how to fix it: adding gateway replicas will not free model compute slots.
The end-to-end trace must start in k6
Every load request should carry a unique W3C traceparent, so you can find the k6 record among server spans without searching by time and URL. The W3C Trace Context Recommendation defines the version-trace-id-parent-id-flags format; the trace ID has 32 hexadecimal characters and the parent ID has 16. All-zero identifiers are invalid.
The test does not need a full tracing SDK. It only needs to create a valid header and store the trace ID as a custom metric tag or diagnostic log field. The following fragment gives every VU and iteration its own identifier range:
import exec from 'k6/execution';

function hex(value, width) {
  return Math.floor(value).toString(16).padStart(width, '0').slice(-width);
}

export function traceContext() {
  const vu = exec.vu.idInTest;
  const iteration = exec.scenario.iterationInTest + 1;
  const traceId = hex(vu, 16) + hex(iteration, 16);
  const parentId = hex(vu * 1000000 + iteration, 16);
  return {
    traceId,
    header: `00-${traceId}-${parentId}-01`,
  };
}
This generator is suitable for a controlled test while the values remain in the safe range of JavaScript Number. For a multiprocess distributed run, add the load-generator instance identifier to the high part of the trace ID or use a cryptographic generator from a k6 extension. A collision is more dangerous than a missing trace because it joins two independent histories and corrupts the phase quantiles.
The gateway must accept the incoming context, create a SERVER span, and pass an updated context downstream. If an intermediate proxy strips traceparent, the chain breaks. Test this with one request before applying load: one trace must contain the client parent, gateway span, queue wait, and generation. The 01 flag asks for the trace to be recorded, but the W3C specification explicitly does not guarantee storage. The server sampling policy therefore belongs in the test configuration too.
Do not use the trace ID as a tag on every standard k6 metric. A unique tag per request creates huge cardinality and can overwhelm the metrics store. For correlation, log the ID only for slow or failed requests, and aggregate metrics by scenario, model, region, and result class.
k6 should measure first byte and full response separately
Grafana k6 documentation defines Response.timings.waiting as the response wait after the request has been sent, and duration as sending, waiting, and receiving combined. For a non-streaming API, waiting is close to time to first byte. For SSE, confirm the behavior of your k6 version with a small test first: some client paths buffer the body, and a tidy metric name does not override the actual implementation.
Below is a minimal test with custom Trend metrics. It sends a fixed prompt so input length does not vary, and records the client envelope, TTFT, and full duration. The URL and token come from the environment, so the secret does not enter the code or tags.
import http from 'k6/http';
import { check } from 'k6';
import { Trend, Counter } from 'k6/metrics';
import { traceContext } from './trace.js';

const ttft = new Trend('llm_ttft_ms', true);
const total = new Trend('llm_total_ms', true);
const transport = new Trend('llm_transport_setup_ms', true);
const failures = new Counter('llm_failures');

export const options = {
  scenarios: {
    steady: {
      executor: 'constant-arrival-rate',
      rate: 8,
      timeUnit: '1s',
      duration: '10m',
      preAllocatedVUs: 40,
      maxVUs: 120,
    },
  },
  thresholds: {
    'llm_ttft_ms{scenario:steady}': ['p(95)<1200'],
    'llm_total_ms{scenario:steady}': ['p(95)<6000'],
    'llm_failures{scenario:steady}': ['count<5'],
    dropped_iterations: ['count==0'],
  },
};

export default function () {
  const trace = traceContext();
  const payload = JSON.stringify({
    model: __ENV.MODEL,
    messages: [{ role: 'user', content: 'Объясни хеш-таблицу в 120 словах.' }],
    temperature: 0,
    max_tokens: 180,
    stream: false,
  });
  const res = http.post(`${__ENV.BASE_URL}/v1/chat/completions`, payload, {
    headers: {
      Authorization: `Bearer ${__ENV.API_TOKEN}`,
      'Content-Type': 'application/json',
      traceparent: trace.header,
    },
    tags: { endpoint: 'chat', model: __ENV.MODEL },
    timeout: '30s',
  });

  ttft.add(res.timings.waiting, { model: __ENV.MODEL });
  total.add(res.timings.duration, { model: __ENV.MODEL });
  transport.add(
    res.timings.blocked + res.timings.connecting + res.timings.tls_handshaking,
    { model: __ENV.MODEL },
  );

  const ok = check(res, {
    'status 200': (r) => r.status === 200,
    'response has id': (r) => Boolean(r.json('id')),
  });
  if (!ok) {
    failures.add(1);
    console.error(JSON.stringify({ trace_id: trace.traceId, status: res.status }));
  }
}
This version intentionally starts with stream: false: it checks correlation and phase budgets without uncertainty in the SSE client. For a real streaming SLO, use a client that records a monotonic timestamp when it receives the first event containing a token, not just the HTTP headers. You can keep k6 as the load generator and run a small compatible client as a separate low-frequency probe. Do not merge its results with the main series until both methods have been checked with identical requests.
Do not treat http_req_waiting as server generation. The metric sees everything before the first byte: the route to the server, gateway processing, queue time, and the start of inference. Only server spans can separate those parts.
The server trace must follow the request path
The gateway root span should cover the request from acceptance until the response write completes. Its children should follow ownership boundaries rather than every function. A practical layout looks like this:
POST /v1/chat/completions          SERVER
  auth.check                       INTERNAL
  request.prepare                  INTERNAL
  route.select                     INTERNAL
  inference.acquire_slot           INTERNAL   llm.phase=queue
  inference.generate               CLIENT     llm.phase=generation
  response.write                   INTERNAL
If the gateway calls an external inference API, inference.generate has kind CLIENT and ends after the response is read. If the model runs in the same process, INTERNAL is appropriate. OpenTelemetry Semantic Conventions define common names for HTTP and GenAI attributes, but the local queue of a particular scheduler remains an operational detail of your system. Do not hide it inside one model-call span, because that removes the trace's diagnostic value.
Record span duration with the SDK's monotonic clock. Add low-cardinality attributes such as llm.model, llm.pool, llm.priority, and the final llm.queue.outcome to inference.acquire_slot. Generation needs the model, output-token limit, actual token count, finish reason, and streaming flag. Do not place a prompt, full response, API key, email address, or individual request ID in attributes indexed by the backend.
Define the queue boundary explicitly in code. For example, set queue_start after validation and pool selection, and call generation_start exactly when the scheduler grants a slot. If a provider exposes only total request time and does not reveal its queue, name the span provider.request. You cannot reconstruct the provider's internal GPU queue by subtraction. That route can only have budgets for the gateway, external call, and client envelope.
Token counters help normalize generation. Full p95 increases with response length even when the model is healthy, so inspect generation_ms_per_output_token and TTFT beside it. Do not divide an error with zero or very few tokens like a normal result; keep errors in a separate class.
The duration difference gives the network envelope
Join the k6 record and root span by trace ID, then calculate network_envelope_ms = k6_duration_ms - server_root_duration_ms. A negative result means the boundaries, units, or correlation are wrong. It does not mean the network made the request faster.
The formula does not need absolute start_time values from two machines. NTP can keep clocks close enough for browsing logs, but drift and step corrections can easily exceed a small network budget. Each observer measures duration with its own monotonic clock, so duration comparison is safer. If the root span ends before the response body has been fully sent, add response.write and extend the root to the actual end of the write.
Build two pairs for a streaming response. Compare client TTFT with server time from request acceptance to the write of the first token. Compare full client duration with the root span through stream closure. The residuals then describe different things: the first includes the request path and first chunk, while the second also includes transmission of later chunks and client reads.
Aggregate after joining individual requests, not by subtracting two independent p95 values. In general, p95(A) - p95(B) is not equal to p95(A - B): different requests land in the tail of each distribution. First calculate the difference for every matched pair, then compute p50, p95, and p99 for that new series. Publish the trace match rate beside it. If the join covers 62% of requests, a precise residual p95 proves very little.
A single-request reconciliation should produce an intelligible report:
trace_id=0000000000000007000000000000012f
k6_total_ms=1842
server_root_ms=1691
network_envelope_ms=151
gateway_ms=37
gpu_queue_ms=428
generation_ms=1210
unattributed_server_ms=16
unattributed_server_ms is the difference between the root span and the selected child phases. A small residual is normal because code runs between spans. A growing residual indicates a missing phase or wrong boundary, and you must not quietly assign it to the network.
Thresholds define a budget, not a fact
Start with the user SLO, then allocate time to components. Do not copy a threshold from someone else's article: the model, response length, region, concurrency, and channel type all change the distribution. For a service targeting TTFT p95 at or below 1,200 ms, an initial budget could be a 120 ms network envelope, 60 ms gateway, 250 ms GPU queue, and 770 ms to first token inside generation. This is an arithmetic example, not an industry standard.
Every budget needs a condition and a window. The phrase "queue p95 below 250 ms" is incomplete without the model, region, priority, input-token range, specified request rate, and at least a ten-minute steady window. Test cold start in a separate scenario. Otherwise, occasional weight loading gets mixed with the steady queue and the team optimizes the wrong mode.
Client thresholds live in k6, while server thresholds are usually calculated by the telemetry backend or a separate post-test check. A useful gate set includes:
network_envelope_ms p95 < 120only for matched traces;gateway_ms p95 < 60without time spent waiting for an external provider;gpu_queue_ms p95 < 250for a specific pool and request class;ttft_ms p95 < 1200andtotal_ms p95 < 6000with a fixed token profile;- error rate, dropped iterations, and the percentage of successfully joined traces.
Do not let fast failures improve latency. Calculate quantiles for successful responses separately, and keep error rate as its own gate. The same applies to client cancellations: a request cancelled after one second must not look like fast generation.
Split the network threshold into setup and residual. blocked + connecting + tls_handshaking exposes connection-pool trouble and TLS setup, while the paired envelope includes data transfer and external load balancers. If setup grows, inspect connection reuse and VU limits. If setup stays flat while the envelope grows with response size, suspect the connection or buffering rather than the GPU.
An open workload model exposes queueing honestly
To find the saturation point, set the request arrival rate independently of response time. k6 constant-arrival-rate starts iterations on schedule; a slow response needs more VUs but does not lower the requested rate. A closed model with a fixed VU count reduces its arrival rate when latency grows and can hide the beginning of a queue.
dropped_iterations is part of the result here. If the generator cannot start scheduled iterations because it lacks VUs, the test did not produce the promised load. You cannot report server p95 for 8 RPS when the actual stream fell to 5 RPS. Increase preAllocatedVUs and maxVUs, or lower the rate to a level the generator can sustain.
Run at least two distinct tests. A steady run at the expected operating rate checks the SLO. A stepped run raises arrival rate and finds the knee: the queue begins growing faster than utilization while throughput stops following the incoming stream. Do not combine their quantiles because the runs answer different questions.
Fix the input- and output-token distributions. One short prompt is useful for comparing infrastructure but poorly represents production. For a realistic profile, prepare several length buckets and serve them in a defined ratio. Do not tag every exact length; use ranges such as input_0_512 and output_129_256, or cardinality will become another incident.
Concurrency and RPS are not interchangeable either. Two requests per second with one-minute generations hold many slots, while the same RPS with short responses creates almost no queue. Report active requests, tokens per second, scheduler batch size, and GPU utilization beside arrival rate. GPU utilization alone does not say whether the system meets user wait-time expectations.
The chart shape points to the owner of the delay
Watch phases move together instead of focusing on the tallest line. The network envelope, gateway, queue, and generation have different causes and react differently as load rises.
Match each symptom to a likely cause and first check:
- Connect and TLS rise while server spans stay flat | the generator opens new connections or exhausts a local resource | connection reuse, socket limits, generator CPU.
- Gateway rises while queue stays flat | rate limiting, serialization, masking, or too few gateway replicas | gateway child spans and CPU.
- Queue rises while generation per token stays flat | inference pool saturation | concurrency, batch policy, queue length.
- Generation per token rises with batch size | an overly aggressive batch or memory pressure | batch size, GPU memory, token profile.
- TTFT is poor while total barely changes | pre-start wait grew and output is short | queue and prefill separately.
- Client total rises while the root span does not | response transfer or work outside the root span | root boundary, body size, load balancer.
Consider a failure that often sends teams in the wrong direction. At 6 RPS, client p95 is 1.4 s; at 9 RPS, it reaches 3.8 s. Generation remains around 1.1 s, the gateway takes 40 ms, and the queue rises from 180 ms to 2.5 s. Adding a gateway timeout would only turn slow successful responses into fast errors. The fix lies in pool capacity, batch policy, the output-token limit, or admission control.
Another case looks similar on the client chart: p95 rises by 500 ms, but every server phase remains unchanged. At the same time, tls_handshaking appears on almost every request. The test has stopped reusing connections, or the load balancer is closing keep-alive sessions. Scaling the GPU would be expensive and useless.
Test the hypothesis with a controlled change. Reduce max tokens while holding arrival rate, then see whether generation and queue time fall. Run the generator closer to the server without changing the server, then inspect the network envelope. Change one factor per run; otherwise the trace shows the composition of the delay but does not prove what caused the change.
Telemetry must not alter the measured system
Recording every span under load can overwhelm the Collector, export connection, or backend. The measurement path then adds latency while dropping the most interesting traces. Before the test, monitor the exporter queue, dropped spans, Collector CPU, and batch export time.
Head sampling is easy to configure, but it decides at the beginning and does not know whether a request will become slow. OpenTelemetry sampling documentation calls out this limitation and describes tail sampling, which evaluates completed spans in a trace. During a load window, a sensible policy keeps every error and trace above a duration threshold, plus a small probabilistic sample of normal requests. If the test needs an exact distribution for every server phase, sampling cannot replace histogram metrics.
Metrics provide stable quantiles over all requests, while traces explain individual tail cases. Instrument the same phase with both signals: the llm.queue.duration histogram builds p95, and the inference.acquire_slot span explains one slow request. OpenTelemetry recommends pairing a significant duration operation with a metric for the same operation; in this case, the recommendation genuinely shortens investigations.
Watch for sample bias in the join. If the backend stores only slow traces, the paired network envelope represents the tail rather than the whole stream. Export a compact server metric with an exemplar trace ID, or enable coordinated sampling during the controlled run and record the rate. A report without its sampling method cannot be reproduced.
Measuring phases does not require prompt or response content. In a regulated environment, recording that content creates exposure risk and increases telemetry volume. Length buckets, model, status, error class, and technical identifiers with limited retention are enough.
One report should support a decision
A good report stores test configuration with the result: the k6 scenario commit, model and endpoint, token profile, arrival rate, generator region, streaming mode, sampling rules, and span schema versions. Without that context, comparing two p95 values means comparing two different experiments.
One screen should show client TTFT and total, the paired network envelope, gateway, GPU queue, generation, error rate, dropped iterations, and join coverage. Show p50, p95, and p99, but make the decision against the SLO selected before the run. If the team moves the threshold above the observed p95 after the test, it is documenting a result rather than running a check.
Keep raw duration pairs for a limited number of runs as well. Aggregates work well for gates, but they cannot recalculate a new budget or inspect a join error later. Trace ID, status, request class, and phase numbers are sufficient; request bodies are unnecessary. Compare releases with the same load profile and record every routing, limit, or hardware-pool change. Otherwise, the difference between builds reflects changed conditions rather than code.
For a model router, add dimensions for the actual provider and model, but do not merge all routes into one tail. AI Router provides one OpenAI-compatible endpoint and routes to different models, so the trace should retain the selected route as a low-cardinality attribute without prompts or personal data. That view shows whether a local gateway or an external inference call added the delay, while keeping the method independent of one provider.
The first readiness test is simple: for a randomly selected slow request, an engineer can find the trace within minutes and explain nearly all duration as a sum of phases. The second test is stricter: automated thresholds fail on the phase that broke its budget, rather than only on total p95. Until both conditions hold, the latency chart reports a symptom without identifying who owns the fix.
Frequently asked questions
Can k6 metrics alone separate network time from GPU time?
No. k6 sees client-side HTTP phases but does not know when a request waited for a GPU slot or when inference started. You need a server root span and child spans joined to the request by trace ID.
Why can't I subtract server p95 from client p95?
The tails of the two distributions usually contain different requests. Match client and server duration for each trace first, calculate each difference, and then compute p95 for the resulting series.
What exactly does http_req_waiting show in k6?
It measures the time from the end of request transmission to the first response byte from the client's point of view. It includes the route to the server, gateway work, queueing, and the start of generation, so it is not GPU time.
How should I measure TTFT for a streaming LLM response?
The client should record a monotonic timestamp when it receives the first SSE event containing a token. Compare it with the server's first-token write time, and measure full duration separately through stream closure.
Which spans are needed for the GPU queue?
Create a separate span from the moment the ready request enters the scheduler until it receives a compute slot. Do not include validation, a gateway semaphore wait, or generation itself.
What is a normal p95 threshold for a GPU queue?
There is no universal number. Allocate a budget from the user SLO and fix the model, priority, token profile, arrival rate, and measurement window so the threshold can be reproduced.
Do k6 and the server clocks need to be synchronized?
Precise synchronization is unnecessary for duration comparison because each process uses its own monotonic clock. Synchronization helps you browse logs by time, but you should not subtract absolute timestamps.
Why is constant-arrival-rate better than a fixed VU count?
It holds the requested arrival rate as response time grows and exposes a building queue. A fixed VU count lowers actual RPS when requests slow down, which can hide saturation.
Can I record every trace during a load test?
Only after checking the capacity of the telemetry path. Monitor dropped spans and the exporter queue; for large runs, combine histograms with sampling that preserves errors and slow traces.
What if the provider does not expose its internal GPU queue?
Do not assign an unknown interval to queueing. Measure the local gateway, total external call, and client network envelope, and mark the provider's internal queue as unobservable.