Token Usage Forecasting: How to Spot Overspending in Time
Token usage forecasting helps you spot overspending early, set thresholds, catch model spikes, and avoid waiting for the invoice at month-end.
Why the bill keeps rising without warning
The bill almost never goes up for just one reason. Usually, several small shifts line up, and each one on its own looks harmless. Yesterday there were a few more requests, today the answers got longer, tomorrow some of the traffic moved to another model. By the end of the month, that becomes a noticeable amount.
A common cause is traffic growth without the same attention to metrics. The product launched a new use case, the team opened access to another department, users started clicking "retry" more often. The number of requests grew by 15-20%, but nobody recalculated the monthly token budget.
The second cause is longer prompts and responses. This happens quietly. New instructions get added to the prompt, chat history starts being attached to each message, RAG begins inserting long document passages. If the model also starts answering in more detail, usage rises from both sides at once: input and output tokens both increase.
Another less visible source of overspending is repeated requests. Timeouts, retries, duplicates from the queue, or a frontend resending the same request after a long load. The user sees one answer, but the system may have called the model two or three times. In the monthly report, that looks like an "unexpected" increase, even though the money went to real calls.
You should also keep an eye on the mix of models. Even if an expensive model gets only a small share of traffic, it can still shift the whole month noticeably. For example, 90% of requests go to a cheaper model, while 10% land on a more expensive one because of fallback, an experiment, or a new route. If those 10% also work with a long context, the average cost per request rises very quickly.
This often happens in teams where all calls go through one OpenAI-compatible gateway. From the outside, the integration does not change, but inside the route, fallback, or limits may have changed. That is convenient for development. Without daily monitoring, it is a budget risk.
Last month’s bill can no longer be fixed. The tokens are spent, the answers are generated, and the invoice only records the fact. After that, the team can usually only explain the overspend, not undo it. That is why forecasting is not for reporting; it is for an early signal, while there is still time to shorten responses, turn off extra retries, or move traffic back to a cheaper model.
Which numbers to check every day
If you look only at the total bill, overspending becomes visible too late. A proper forecast needs a daily snapshot that shows not just the amount, but also why it is growing. Otherwise, one release or one noisy API key can burn through a week’s budget in a couple of days.
The minimum set of metrics is best kept in one table or one dashboard:
- input and output tokens separately
- number of requests per day
- errors and repeated requests
- usage by model, team, and API key
- actual cost for each model
Input and output tokens should always be separated. Growth in input usually means more context, chat history, or system text went into the prompt. Growth in output usually points to something else: the model started answering at greater length. That is what inflates the bill especially fast.
The number of requests should be viewed alongside tokens. If requests are up 10% and tokens are up 60%, the problem is not the traffic itself. It means each call got heavier. The reason is often simple: a system prompt was changed, RAG context was added, or the response limit was raised.
Errors and retries cost money too. If the service hits a timeout and the client silently sends the same request again, usage rises without any benefit. In the logs, this shows up as a series of similar calls with the same API key over a short period.
A breakdown by model, team, and key is needed to find the source of the spike. The total number rarely helps. It is much more useful to see that one team moved part of its traffic to a more expensive model or that one integration key started sending batches of requests at night.
Do not look only at tokens; look at the price of the chosen model too. The same amount of tokens can cost different amounts. If routing changes between providers and models, that becomes especially obvious.
Another simple habit is to mark days with releases, campaigns, mass document uploads, and batch jobs. Without those notes, it is easy to confuse a normal spike with an anomaly.
How to build a forecast step by step
An accurate forecast does not require a complex model. Usually, data from the last 14-30 days is enough, as long as you have not changed the product, prompts, or model set. A shorter period is often noisy, while a longer one pulls in old behavior that no longer reflects the current month.
First, collect the daily numbers in one table: date, number of requests, input tokens, output tokens, model, team, or service. If you have multiple scenarios, do not mix them into one row. Support chat, internal search, and document generation have different usage patterns, and averaging them only gets in the way.
Then split the days by type. Weekdays usually have more traffic and are steadier. Weekends are lighter. Also mark the peak days separately: an email campaign, a new feature launch, a large team test, mass file processing. Those days should not be hidden inside the overall average, or the forecast will look too calm.
A convenient calculation flow looks like this:
- For each scenario, calculate the average number of requests on a weekday, on a weekend, and on a peak day.
- For the same groups, calculate the average token usage per request.
- Multiply the expected number of requests left in the month by the average usage in each scenario.
- Add the results to get the total token volume and an estimated amount.
The formula is simple: 12,000 requests x 2,500 tokens per request = 30 million tokens. If you have three such scenarios, calculate each one separately and then add them together. That way, you can immediately see which flow is eating the budget and which one barely affects the bill.
Next, compare the result not with the current spend, but with the team’s limit for the rest of the month. If the forecast shows 85-90% of the limit already halfway through the month, do not wait for the invoice. Check what changed: did response length increase, did the team enable a more expensive model, are users retrying more often, or did one service get stuck in a retry loop?
A small example. A team sees that on weekdays the service makes 8,000 requests per day at 1,800 tokens each, while on Fridays, after report exports, it jumps to 14,000 requests at 2,400 tokens each. That spike should not be spread across the month. It needs to be counted separately. Otherwise, the calculation will show a calm picture, and the bill will come out very differently.
If calls go through a single gateway with audit logs by key and model, this kind of breakdown is easier to collect. For example, in AI Router you can view usage by service, key, and route in one place without changing your usual SDKs and code.
How to account for spikes before they break the budget
Average daily usage almost always feels too reassuring too early. Budgets are usually broken not by smooth growth, but by a couple of sharp spikes: a feature release, a marketing email, overnight batch processing, or an emergency fallback to another model.
That is why a separate spike scenario should sit next to the normal forecast. Not one generic "just in case" multiplier, but several clear reasons for growth. That makes it easier to see where the real risk is and where you simply padded the estimate too much.
For releases and promo campaigns, count not only new users but also request frequency per person. After launch, people often try the feature several times in a row, and tokens grow faster than session count. If a promo drove traffic up 40% last month, check whether model load rose by 60-80% because of retries and longer conversations.
Also keep an eye on prompt changes. The team updates an instruction, adds more context, examples, or formatting to the response, and then looks only at quality. The bill rises at the same time for two reasons: input grows, and the model starts answering at greater length. Even an extra 300-500 tokens in the response quickly becomes a noticeable amount at scale.
Another common source of overspending is fallback to a more expensive model. This can happen during outages, provider limits, or routing changes. Sometimes just 5% of such requests is enough to push the monthly forecast upward.
Nightly jobs, reindexing, mass product card generation, and chat archive summarization should also be counted separately. If you look only at daily product traffic, these jobs are easy to miss.
It is enough to keep a buffer across four risk areas:
- releases and promos
- longer prompts and responses
- fallback to a more expensive model
- batch and overnight jobs
If even one of them starts rising, recalculate the forecast the same day and set the warning threshold not by money, but by tokens per scenario. That way, you see the problem before the bill shows it.
Which anomalies to catch right away
What usually breaks the bill is not one big failure, but a quiet shift in metrics that nobody noticed on day one. The most common example is when the model starts answering at greater length, and the average number of output tokens rises by 20-40% without any growth in request count.
This can happen after a system prompt change, a model switch, or a new feature launch. If yesterday the average response was 900 tokens and today it is already 1,300, usage will climb quickly even with the same traffic.
Watch usage per API key. One service, a staging environment, or a bad script can easily eat a noticeable share of the monthly budget. The warning threshold can be very simple: if one key suddenly uses 2-3 times its usual daily amount, the team should immediately check what it is sending and to which model.
Errors also cost money. When retries rise by the hour, usage often doubles almost unnoticed: the first request fails, the second goes through again, and then the client sends the same text once more. If at 2:00 PM you usually have a 1% error rate and today it is 8%, that is not noise anymore.
Another frequent cause of overspending is a shift toward expensive models. The team may not change anything in the product, but part of the traffic suddenly moves from a cheaper model to a more expensive one. Sometimes routing is to blame, sometimes a new prompt, and sometimes a developer simply forgets to revert a test setting.
Five simple alerts work well:
- growth in average output tokens by model and scenario
- a spike in spend for one key
- a jump in errors and retries by hour
- a rising share of expensive models in total traffic
- daily spend above forecast for three days in a row
The last point is often underestimated. One bad day can still be dismissed as random. Three days in a row almost always mean the current forecast is no longer valid and the month will end above plan unless something changes.
Example: a team spots the risk in week two
A support team uses two LLM tools. The first answers customers in a chatbot. The second helps internal operators: it finds articles in the knowledge base, drafts replies, and pulls the needed details from long instructions.
In the first week of the month, everything looked calm. The chatbot used about 2.1 million tokens per day, and the internal assistant used another 900,000 or so. That came to about 3 million tokens per day in total. At that pace, the monthly forecast was around 93 million tokens. The team was within budget, with little margin but no alarm.
On day nine, they rolled out a release. They added new rules to the system prompt and allowed the model to answer in more detail to reduce follow-up questions. Traffic barely changed, but the average response got much longer: it had been around 220 output tokens and became around 540.
Two days later, daily usage climbed to 4.4 million tokens. The bill had not arrived yet, but the alert had already fired. It watched not only the raw number, but also the pace over the last few days. After recalculating, the forecast for month-end rose from 93 million to 129 million tokens. The team still had almost two weeks to fix the situation.
They reacted quickly. They shortened the system prompt, removed long internal explanations, and set a response length limit. For simple requests, the bot returned to short answers, while longer replies were kept only where they were truly necessary. For the internal assistant, they added a separate limit, since operators could always ask a follow-up question.
A couple of days later, the average response dropped to about 300 tokens, and daily usage returned to 3.3 million. The new forecast showed about 101 million tokens. That was still above plan, but no longer a budget failure.
The difference in the bill was significant. Without the early alert, the team would have gone over plan by roughly 36 million tokens. With the alert, the extra volume was about 8 million. That kind of spike is much easier to explain to finance and to the product lead. The takeaway is simple: anomalies often do not start with a spike in requests, but with one release that makes every answer longer.
Where teams make mistakes most often
Teams usually make mistakes not in the formula, but in the assumptions. Forecasts fail when they are built on too rough a picture of real traffic.
The first mistake is looking only at the monthly average. That number smooths out exactly what creates overspending: releases, ad campaigns, overnight jobs, and end-of-week spikes. If things are quiet for 20 days and then the service answers three times more often for three days, the average will almost hide the problem.
The second mistake is putting all models into one row. Two services can have the same number of requests but very different response costs. One team sends short prompts to a cheap model, while another sends long context to a more expensive one. If you mix them into one number, you will not see the source of the overspend.
The third mistake is not counting repeated requests after failures. A timeout, a 429, a network issue, a retry from the queue, or a fallback model after an unsuccessful answer - and one user request already used twice as many tokens. These things often hide in application logic, not in billing.
The fourth mistake is setting the warning too late. An alert on the day the budget is almost gone does little good. The team gets a signal, but it is already too late to lower limits, disable the expensive route, or shorten prompts. The threshold should be tied not only to the amount, but also to the pace. If by the 10th you have already spent 45% of the monthly budget, the traffic needs to be reviewed right away.
The fifth mistake is keeping one shared limit for everyone. Then overspending turns into an argument between teams instead of a manageable task. When every service has its own limit, owner, and daily plan, the source of the problem is visible within minutes.
A simple rule is enough: do not track only total spend, track spend by owner, model, and failure type. Then the anomaly appears before the invoice does, and the team still has time to fix something.
A quick weekly check
A weekly review takes 15-20 minutes, but it often protects the budget better than any end-of-month report. If you look at the same numbers on a schedule, forecasting quickly stops feeling like guessing.
Usually five steps are enough:
- compare daily usage to the plan day by day, not just the total for the week
- check the average number of tokens per request and compare it with last week
- break down the biggest increase by team, product, model, or provider
- make sure alerts trigger quickly and do not stay silent during a test overage
- after every significant release, review limits and thresholds
It also helps to write down the reason for growth in a short note. A line like "after the search release, average output tokens grew from 900 to 1,400" is much more useful than a long report with no conclusion.
When the week ends with a deviation, take at least one action right away: reduce max tokens, shorten the context, switch part of the traffic to a cheaper model, or set a stricter limit on the key. Otherwise, a small shift over seven days turns into an unpleasant surprise by the end of the month.
What to do next to keep usage under control
Usage almost never grows on its own. Usually, the numbers just sit there without an owner. Assign one person to own the forecast, watch the alerts, and review deviations from plan once a week. It can be a tech lead, a FinOps manager, or a product owner, but the name should be one.
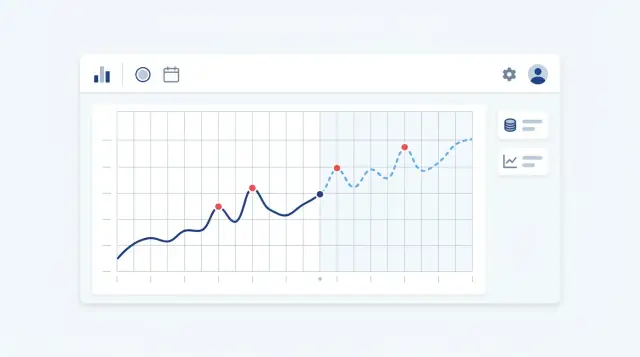
You do not need a complex forecast to start. A simple dashboard is enough, showing tokens per day, money per day, cumulative usage since the start of the month, and the expected amount by month-end. That is already enough to spot a bad trend a few days early, instead of only when the invoice arrives.
Set two warning thresholds right away. The first should fire early, when the team can still safely adjust prompts, shorten responses, or move part of the requests to a cheaper model. The second should be stricter: at that point, you temporarily cut limits, disable nonessential scenarios, and look separately at who caused the spike.
It is better to keep limits at several levels. A single ceiling for the whole account rarely saves you from surprises. Limits by key, by team, and by scenario - such as the support chatbot, internal search, or nightly jobs - are much clearer. Then one bad release does not eat the whole monthly budget.
If calls go through a single OpenAI-compatible gateway, it is convenient to keep usage, rate limits, and audit logs in one place. For teams in Kazakhstan and Central Asia, AI Router at airouter.kz handles this well: it makes it easier to see not only the final amount, but also which key, model, or service caused the overspend.
Once a month, compare the forecast with the actual result and adjust the calculation itself. If the average response used to be 900 tokens and is now 1,400, the old coefficient is already wrong. If a new feature increased the share of expensive models, that should also be reflected instead of being dismissed as a one-time spike.
The working rhythm here is pretty boring, and that is a good thing: one owner checks the numbers every week, the dashboard shows the actuals and the forecast, two alert thresholds trigger different actions, limits are set by keys and scenarios, and once a month the team updates the calculation. For LLM API usage, habits like these work best, not a heroic cleanup on the last day of the month.