Tail latency in LLMs: how to find the slowest 1% of requests
Tail latency in LLMs often hides in long prompts, cold models, and tools. We show how to find the slowest 1% and remove the bottlenecks.
Why a small share of requests gets stuck
Tail latency in LLMs has an annoying trait: users do not remember the average response time, they remember the rare long pause. If 99 messages arrive in 2 seconds and one takes 18, that one response ruins the impression.
This is especially noticeable in chat. A person waits, clicks again, thinks the window has frozen, or just leaves. A streak of fast replies does not help if an important question suddenly needs half a minute to think.
Average latency looks good in a report, but it does a poor job of showing the real experience. It smooths out spikes, so the team sees a “normal” number while support gets complaints about slow LLM requests.
The latency tail usually appears not on simple replies, but on heavy branches: a long prompt, a large context, an external tool call, or a long answer. During peak hours, queueing gets added on top, and the same scenarios become even slower.
Even if a company works through a single OpenAI-compatible endpoint, the overall picture can look stable while a small part of traffic goes through a much heavier route. The user does not see the internal setup. They only see that the answer came too late.
That is why the average is almost useless without p95 and p99. Until you look at percentiles by request type and time of day, the slowest 1% will stay hidden behind a pretty overall metric.
Where the latency tail usually hides
In most LLM apps, average latency looks acceptable until the team breaks down p95 and p99. That is where the tail is hiding: one user waits 2 seconds, another waits 18, even though the requests look similar at first glance.
A common cause is an oversized system prompt and too much context. The model reads every token before it starts answering. Extra instructions, long chat history, and big knowledge-base inserts quickly add seconds. It gets especially painful when 90% of requests are short, but rare dialogs drag the entire archive along with them.
The second type of problem is not about text, but about model state. After a period of inactivity, some models start more slowly: the container wakes up, the GPU gets loaded, the cache is empty. To the user, it looks like a random slow response, even though nothing in the code changed. That cold start is easy to confuse with a network problem.
Tool calls also eat up a lot of time. Search, CRM, a database, or an internal API may take longer than generation itself. The LLM has already chosen the tool, but then it waits for slow SQL, a busy search index, or a service that responds in bursts. If the chain calls several tools in a row, latency grows almost invisibly until you inspect the trace step by step.
There is also a more ordinary cause: retries after a timeout. One service did not get a response in 5 seconds and sent a retry. Then the next layer did the same. In logs it looks like the model is simply slow, but in reality the system multiplied the load by itself.
Provider queues during peak hours are a separate story. During the day everything is fast, but in the evening part of the traffic waits before inference. In a multi-provider setup this becomes very visible: the same model can behave differently across providers with the same prompt.
Usually, the tail is worth looking for in five places:
- size of the system prompt and total context
- cold starts after a pause
- latency of each tool call
- retries after a timeout
- queueing at the provider or inside your own gateway
If you only watch the total request timer, all of these causes blend together. Then a long context, a cold start, and a slow tool all look like one problem, even though they need different fixes.
How to break latency into stages
Total latency helps very little when you are trying to find the slowest 1% of requests. One 10-second response may be slow because of a long prompt, a cold model, a repeated request, or a slow tool. As long as all of that sits inside one number, the cause stays hidden.
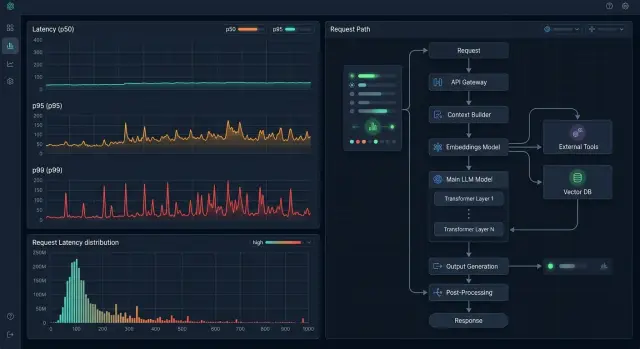
It is more useful to look at the trace of each request as a chain of steps:
- entering the API gateway and doing the initial check
- choosing the model, provider, or route
- waiting for the first token from the model
- generating the response until the last token
- calling tools and returning the result to the client
This kind of breakdown is especially useful if your team works through a single OpenAI-compatible gateway like AI Router. Then you can see the time at the gateway entry, routing, and model response separately instead of folding everything into one metric.
Without tokens, the picture is blurred too. Log how many tokens came in and how many the model returned. Then you can see whether the problem is input length, or whether a short prompt somehow waited longer than usual.
Tools are better measured one by one, not under a single "tool calls" label. A database lookup in 300 ms and an external scoring request in 4 seconds are two very different stories. If an agent made three calls in a row, each one should have its own start time, end time, and status.
Mark retries, timeouts, and route changes clearly too. Otherwise, a request that first hit a slow backend and then went another way will look like a random spike. In reality, that is already a different execution path.
Compare p95 and p99 only within the same scenario. Do not mix support chat, batch document processing, and an internal assistant into one metric. Even within a single product, it is better to split requests by prompt template, model, and whether tools are used.
If a scenario has a p95 of 2 seconds and a p99 that jumps to 11, look not at the average, but at the rare branches. The tail almost always sits in one specific stage: a long input, a cold start, a slow tool call, or a hidden retry.
How to catch the slowest 1% step by step
Trying to find the tail across all scenarios at once is almost always useless. There is too much noise. It is easier to take two slices: the most common scenario users run every day, and the one that is most expensive in time or money.
You do not need a pretty dataset, you need an honest one. Export at least 1,000 real requests and do not clean them by hand. Do not remove long dialogs, strange repeats, broken phrases, or rare tool calls. That is exactly where the slow requests often hide.
A workable process is simple:
- collect the same fields for every request: prompt length, chosen model, number of tool calls, time to first token, and total response time
- split the data into groups: short and long prompts, fast and slow models, requests without tools and requests with them
- look at p99 separately and ask what the slowest requests have in common
- test one hypothesis at a time and validate it with a separate experiment
A common mistake is simple: the team changes the model, token limits, and tool-call order all at once. The graph may improve after that, but the real cause will still be unknown.
A small example. If almost all of the p99 requests are longer than 12,000 tokens and include two calls to internal services, start with separate tests: first shorten the context on the same model, then disable one tool on the same request set. That makes it faster to see where the seconds are going.
What long prompts do
A long prompt almost always hurts time to first token. The model reads the input first, and only then starts answering. If the request is bloated, latency grows before generation even begins.
That is why the tail often hides not in the answer itself, but in the input tokens. The same scenario can run quickly 99 times, and on the 100th request it stalls simply because the history got too long.
Most often, the new question takes little space while the old context takes a lot. The user writes one sentence, but the system sends 20 previous turns, long operating instructions, tool descriptions, and chunks of knowledge-base content. The model reads all of that again every time.
The usual sources of wasted load are the same ones: repeating response-format rules in every request, sending the full chat history instead of a short summary, using the same rule blocks for every scenario, and shipping large tool schemas when only one simple call is needed.
That kind of ballast rarely improves the answer. It does, however, easily add seconds to the latency tail.
A good example is a bank support chat during peak hours. The customer asks why a card was declined, and the app sends not only the question but also the full conversation, old checks, a politeness template, compliance rules, and descriptions of five tools. The answer is short, but the model spends time reading what it does not need.
Usually, the fix is not to “cut everything,” but to clean up the context. It is better to compress the chat history into a short summary after a few turns. Store fixed instructions in the template instead of duplicating them ten times. If some data does not affect the answer, it does not need to be sent.
In practice, four measures work well: keep only the most recent relevant messages, summarize older steps, remove duplicate rules, and pass only the documents that relate to the current question. In many cases, that is enough to remove slow LLM requests without a noticeable drop in quality.
If p50 barely changes after context reduction but p99 drops noticeably, the cause was the heavy prompts.
Why cold models respond more slowly
An LLM can be slow for reasons other than a long prompt. Very often the problem is that the model itself is “cold”: it has not been called for a while, and the provider is not keeping it fully ready. Then the first request pays for loading weights into memory, preparing the GPU, and starting the whole stack. To the user, the picture is simple: yesterday it took 2 seconds, and now it suddenly takes 12.
This is more common with niche models. Popular options are usually kept warm because traffic keeps flowing. But a niche model, a new release, or a fine-tuned version may sit idle for hours. After a pause, the first call is often the slowest, and the ones after that are steadier.
Autoscaling also changes the picture during the day. At night the provider may keep fewer instances, in the morning it may spin up new ones, and at peak time it may redistribute load across regions and queues. As a result, the same request at 10:00 and at 14:00 can behave differently even though the prompt did not change.
The difference between providers can be very noticeable. The same request to the same model can start fast with one operator and slowly with another because their warm-up and queue policies differ. If you have a single gateway, those differences are easier to compare on one request set.
The practical approach is simple: separate time to first token from total response duration, mark whether the request was the first one after downtime, and look at latency by provider, model, and time of day. If cold starts happen rarely, that is already enough to spot the pattern.
A fallback route is useful too. When the main model wakes up too slowly, the system can send the request to another backend or to a model with similar quality. The user will not notice the internal switch, but they also will not wait an extra 8–15 seconds.
A cold model is not a bug or “random noise” in the chart. It is a normal property of infrastructure. If you do not account for it in tracing and routing, the slowest 1% will keep looking unexplained.
How tools add seconds
When a response is slow, the cause often is not the model itself. The model is waiting on an external call, and the whole response is paused until search, a database, or a third-party API comes back.
Document search adds time in several places at once. Network time to the storage system adds extra hundreds of milliseconds, the index may respond unevenly, and filters by date, role, or product make the query heavier than it looks. If the system pulls too many chunks and then spends a long time ranking them, latency grows even before the first token.
SQL can be even harsher. Wide selects, unnecessary fields, sorting over large tables, and joins without proper indexes can easily add 2–5 seconds. Teams often only look at whether the query “works,” but do not check how many rows it actually reads.
One slow API can hold the whole response. That happens with CRM, anti-fraud, payment services, or an internal catalog. If the call chain runs sequentially, each pause is simply added to the next one.
A faster approach is usually this:
- search documents and fetch the customer profile in parallel
- set a timeout for every external call
- return a partial answer if a secondary tool does not finish in time
- cache frequent lookup requests
If you route traffic through one gateway, separate model time and each tool call in the logs. Otherwise, it is easy to think the model is slow when the external service is actually eating the seconds.
Average response time is almost useless here. Look at p95 and p99 for each tool separately. Then it becomes clear who is hurting the latency tail.
Mistakes that make the cause harder to find
Average response time almost always gives false comfort. If the system responds in 2 seconds on average, that does not mean the user experience is good. One percent of requests may hang for 12–20 seconds, and those are the ones that break the experience.
Another common mistake is putting different scenarios on one chart. A short chat question, a knowledge-base search, and a long document analysis put different kinds of pressure on the system. If you mix them into one line, you get an “average temperature” and miss where the slow requests are born.
Many teams do not save prompt size next to latency. Later they see a spike and argue about whether the model or the network is at fault. In reality, the cause may be simpler. The input grew from 2,000 to 20,000 tokens, search added extra chunks of text, and the model started reading longer and generating longer. Without input length, output length, and the number of tool calls, the picture is almost blind.
People often fix the wrong layer. The team changes the model, tweaks temperature, and adjusts parameters, but the slowdown is in an external service: search, CRM, anti-fraud, or a document database. If the model started answering quickly and then waited 4 seconds for a tool result, the problem is not the model.
Another miss is drawing conclusions from a few lucky runs. The tail is rarely caught with five tests in quiet conditions. It shows up under load, on a cold start, on a rare long prompt, or during a slow external call.
The discipline here is simple:
- measure p50, p95, and p99 separately
- split requests by type instead of mixing everything together
- save tokens, context size, and the number of tool calls
- measure stages separately: routing, model, search, and tool calls
When that data sits together, there is less room for argument. The cause is usually clear after one review, not after a week of guessing.
A quick checklist before you start
Before you look for the cause, do not look at average response time. It almost always gives false comfort and almost always lies. The tail is only visible when bad cases are measured separately.
Check the basics:
- you have p95 and p99 not just for the service as a whole, but for each scenario: chat, summarization, RAG, and agent tasks
- you can see time to first token and total response time separately
- logs keep prompt size, output token count, retries, and every
tool callwith its duration - the model timeout and the tool timeout are set separately
- there is a simple fallback route: another model, another provider, or a shorter path for critical requests
If even one of those is missing, the investigation will quickly run into guesses. You will see an 18-second request and think the model is to blame. Then it turns out the model produced the first token in 900 ms, and 14 seconds went to a slow database search and a repeated tool call.
It helps to keep one screen or one log query where the whole chain sits together: input, routing, model call, tools, retries, final result. In an OpenAI-compatible setup, that is especially convenient because the event format can stay the same even when you switch providers.
And one more practical step: test the fallback route ahead of time, not during an incident. When p99 suddenly jumps, you do not want to fix the problem and triage complaints at the same time.
Example: a bank support chat at peak hours
A bank’s support chat runs smoothly during the day. Most questions are simple: “Where can I see my limit?”, “Why did the payment fail?”, “How do I change my number?” These requests fit into 2–4 seconds. But in the evening, p99 suddenly climbs, even though the average latency barely changes.
The problem appears in a different type of dialog. A customer writes after a long conversation, forwards card details, a disputed transaction, and earlier support cases. The model gets a huge context, spends more time reading the history, and starts answering later. That is how the tail hides: 99% of the chat looks fine, while one rare heavy request breaks the SLA.
There is a second slowdown in this scenario too. When the bot has to check the card status, it goes to an internal bank service. The LLM itself responds quickly, but the old API sometimes holds the request for 6–8 seconds. The user sees one combined reply and does not realize that the delay came not from the text block, but from an external tool.
Teams usually remove part of the tail with two simple measures. First, they compress the history: keep the latest turns, customer facts, and a short summary of the old dialog instead of the full log. Then they cache common reference answers, such as fees, limits, and card reissue information. That does not fix everything, but it removes a noticeable share of slow requests.
If evening traffic grows and the main model starts responding more slowly, a fallback route helps. Some requests can be sent to another model with similar quality but more stable latency. The answer may sound a little simpler, but the chat stays within SLA and the queue does not grow.
This example shows a simple rule: do not look for “a slow chat”; look for a rare combination of factors — a long context, an external call, and an overloaded or cold model.
What to do next
Do not try to fix the whole platform at once. Pick one scenario where latency affects people directly: support chat, knowledge-base search, or an internal assistant for operators. Collect a small set of real requests, at least 100–200, and run only those.
Then remove the most obvious sources of the tail. In many cases, latency grows not because of the model itself, but because of extra context and one slow tool call that sometimes hangs for 3–5 seconds. If the answer does not change without part of the system prompt, long history, or an external step, remove it without regret.
After that, it starts making sense to compare routes. The same request set may show that a more expensive model answers faster on long tasks, while a simpler model wins on short ones. Those conclusions only appear under the same load, not from the overall average in production.
If you need a single OpenAI-compatible endpoint for these tests, it is convenient to work through AI Router at airouter.kz. It lets you run requests through one API without changing your SDK, code, or prompts, and for teams with data residency and local-latency requirements, it also supports hosting open-weight models in Kazakhstan. That makes route comparison on the same request set much easier.
The main point is to measure not the average latency, but the path of a specific request step by step. Then the most annoying 1% stops being a mystery.
Frequently asked questions
What is tail latency in LLMs in simple terms?
These are the rare requests that take noticeably longer than the rest. Users remember them more than the average response time. If most responses arrive in 2 seconds and a few take 12–18 seconds, that tail is what hurts the experience.
Why not just look at average latency?
Because the average smooths out spikes. It can look “normal” even when p99 has already climbed and some users are waiting far too long. For chat and agent flows, that is especially bad: one slow reply can ruin the experience more than dozens of fast ones.
Which metrics actually help catch the slowest 1%?
Start with p95 and p99 for each scenario separately. Then add time to first token, total response time, input size, output size, and the duration of every tool call. Those numbers quickly show where the seconds are going.
Where do the slowest requests usually hide?
Most often the tail hides in a long system prompt, a bloated chat history, a cold model start, a slow external service, or retries after a timeout. During peak hours, queueing at the provider or inside your own gateway often adds to that.
How do I tell whether the model or an external tool is slowing things down?
Break the request into steps and measure each one separately. If the first token arrives quickly but the full response is slow, look at tools and external APIs. If the delay grows before the first token, the usual suspects are a long context, queueing, or a cold model.
What if the latency tail is caused by a long context?
Start by removing the obvious extra weight. Keep only the relevant messages, compress older chat into a short summary, stop repeating the same rules in every request, and do not send documents just in case. In many cases, that is enough to bring p99 down without losing quality.
How can I recognize a cold model?
Look at the first request after a pause and compare it with normal calls to the same model. If the first response after downtime is much slower and the next ones are stable, you have a cold start. In production, a fallback route to another backend or a more stable model helps.
Can retries create slow requests on their own?
Yes, and it is a common cause. One layer times out and retries, then the next layer does the same, and the system ends up adding its own load. Set clear timeouts, mark every retry in the logs, and check whether the retries are duplicating each other.
What is the minimum logging needed for a proper diagnosis?
A simple set is enough: scenario, model, provider, time to first token, total time, input and output tokens, number of tool calls, duration of each call, timeouts, and retry. If you use one OpenAI-compatible gateway, keep the format the same for every route. That way, comparisons do not break when you change providers.
How can I reduce p99 without a big rebuild?
Do not change everything at once. Take one common scenario, collect 100–200 real requests, and test hypotheses one by one: shorten the context, remove one tool call, switch the route, and separate model and tool timeouts. That way you quickly see what is cutting the tail instead of just shifting the graph.