LLM Pricing Comparison: How to Calculate the Final Price Fairly
LLM pricing comparisons often break because providers use different billing units. We show a conversion table, formulas, and scenarios where a low rate still leads to a high final bill.
Why prices are hard to compare
The problem does not start with the rates, but with the fact that providers bill different things. One shows a price per 1M tokens, another per 1K requests, and a third charges separately for processing seconds or cache storage. The numbers sit next to each other, but you cannot compare them directly.
Because of that, a pricing page looks clear only at first glance. Each row has its own unit, its own billing logic, and its own set of extra charges. Usually, one tariff mixes several cost parts at once: input tokens, output tokens, cached tokens, and a separate fee for a large context.
If you do not reduce everything to one formula, the option that looks cheaper is almost never the one that will actually produce the lower bill at the end of the month.
A good example is a bank support chat. A user asks a short 80-token question, and the model answers with 900 tokens. If you look only at the input price, it is easy to choose the provider with the lowest rate and assume it is the best deal. In practice, the output often makes up most of the bill in this kind of scenario.
There is another source of confusion too. One provider gives a big discount on cache, another barely distinguishes between normal input and repeated requests. In some cases, a long context is already included in the price; in others, costs rise sharply after a certain threshold. So two similar scenarios can differ in price by several times.
Even if a team works through a single gateway with one API, the problem does not disappear. It is more convenient to connect models that way, but the economics still need to be measured by shared rules: how much input you have, how much output, what your cache hit rate is, and what the average context size looks like.
Until you have that shared formula, pricing pages look simpler than they really are. A low input rate catches the eye, but the final bill is usually decided by the details in the neighboring column.
Which units appear in pricing pages
For two providers, the price can look almost the same even if one bills tokens, another bills audio minutes, and a third sells fixed monthly capacity. The mistake begins on the first step if you focus only on the smallest number.
Most often, tariffs are split into input and output. Input tokens are the text of the request, the system prompt, the chat history, and service instructions. Output tokens are the model’s response. And output is often what pushes the bill higher, because long answers cost more than short requests.
| What is billed | How it is usually shown | Where people often make a mistake |
|---|---|---|
| Input tokens | price per 1M input tokens | They do not account for a long system prompt and chat history |
| Output tokens | price per 1M output tokens | They look only at the input price and forget about long answers |
| Cached tokens | cached input, prompt cache | They count repeated calls as normal and miss the savings |
| Images and audio | per image, per minute, per second | They confuse a token tariff with a media tariff |
| Characters | per 1K chars | They compare characters with tokens without conversion |
| Dedicated model or GPU | monthly instance, reserved capacity | They do not spread the fixed fee across real usage |
Cached tokens can change the final cost much more than it seems. If a support bot sends the same large system prompt every time, part of the input on repeated requests can become much cheaper. But if cache is not enabled or expires quickly, that saving disappears.
Multimodal tasks create even more confusion. One service charges per image size, another charges by the number of tokens after conversion, and a third charges per minute of audio. In that kind of pricing page, you cannot simply place two rows side by side and pick the lower price.
There is also a less obvious billing unit: speed limits. A provider may offer a low price but severely restrict RPM or TPM. Then the team has to keep a backup channel, split traffic across several accounts, or move to a more expensive plan. On paper, tokens are cheaper; in practice, the launch ends up costing more.
A separate case is a fixed fee for a dedicated model or GPU. That can sometimes be a good deal for stable, heavy workloads, especially when in-country data storage and predictable latency matter. But with uneven traffic, part of the paid capacity sits idle, and the average price per request rises quickly.
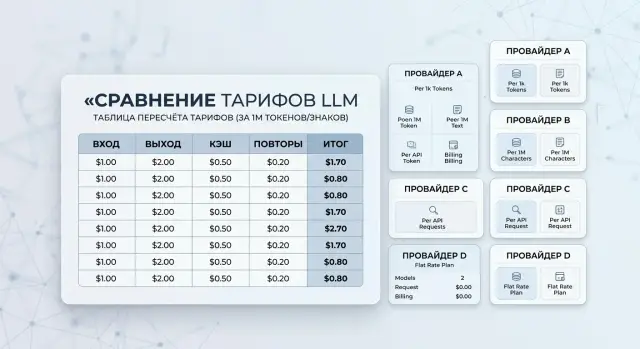
How to build a conversion table
A table works only when every row uses the same base. For text models, the most convenient option is to reduce everything to a price per 1M tokens. If a provider sells calls instead of tokens, keep a second base nearby: price per 1,000 requests. Then convert calls into tokens using your own average volumes and compare the rows without confusion.
One number from the pricing page is almost never enough. In a real bill, there is input, output, cache, repeats, and context limits. If that is not in the table, it may look neat, but it will be wrong.
A useful working table usually includes these columns: provider and model, original billing unit, input and output token prices, price for writing to cache and reading from it, average retry rate, working context size, and the rounding rule used for billing.
Then fill in your own numbers. Do not use a marketing example like "200 input and 50 output tokens" if your support replies are three times longer on average. It is better to export 3-7 days of logs and calculate the average, median, and 90th percentile for both input and output. That way, you can immediately see where a cheap input becomes expensive because of a long answer.
It helps to keep two calculation modes:
- normal day - average request length, normal cache share, few retries;
- peak - longer conversations, more parallel calls, higher retry rate.
This is not just a formality. Some models look profitable under calm load, but become expensive fast during peaks because of long output or because part of the history has to be sent again.
Mark rounding rules clearly. One provider counts actual tokens, another rounds up to 1,000 tokens, and a third charges a minimum per request. On short messages, the difference is noticeable. If a user sends 120 tokens and billing counts it as 1,000, the price on paper and the price at the end of the month will be very different.
And even when you work through a single gateway, the table is still needed. A single API makes integration easier, but you still choose the model and provider based on your own volumes and workload.
How to calculate the final price step by step
A fair calculation starts not with the pricing page, but with the same workload. If you compare providers on different requests, the numbers almost always mislead. For this kind of comparison, it is better to take a small but real sample: 100 live requests from logs, a pilot, or a load test.
- Collect a sample of requests of the same type. Do not mix support chat, knowledge-base search, and long document generation. Each scenario has its own input size, output size, and cost.
- For that sample, measure the average number of input tokens, the average number of output tokens, and the share of responses that came from cache. If the provider counts cached input separately, that changes the total right away.
- Take each provider’s rates and multiply them by your volumes. Calculate input, output, and cache separately, not as one combined line. Output token price is often what turns a cheap plan into an expensive one.
- Add the losses people usually forget: repeated requests after errors, timeouts with retries, answers longer than normal, and service calls for classification or moderation. In production, this is part of the bill, not noise.
- Convert the result into a clear scale: the cost of 100 requests, the cost of a day, and the cost of a month. This makes it easier to see where a difference of a few tenths of a cent per call turns into a meaningful expense line.
If you want a very simple formula, it looks like this: total = input * input rate + output * output rate + cache * cache rate + media + retry cost.
Example: a bank support chat
In a bank support chat, a user often writes very briefly: "Why is my card not going through?" or "How do I raise my limit?" But the bot rarely answers that briefly. It has to take security rules into account, add steps for the customer, and give a careful answer without making promises it cannot keep.
Because of that, these tasks usually have more output tokens than input tokens. So if you look only at the input price, the picture is almost always wrong.
Suppose one conversation looks like this:
| What the conversation includes | Volume |
|---|---|
| System instructions and bank rules | 300 tokens |
| Customer question | 30 tokens |
| Retrieved knowledge base snippets | 120 tokens |
| Bot response | 900 tokens |
For a fair comparison, we first convert everything to the same base, for example a price per 1M tokens. Then you see the real cost in a working scenario, not the marketing number.
| Provider | Input per 1M tokens | Output per 1M tokens | Cost of one conversation | Cost of 10,000 conversations |
|---|---|---|---|---|
| A | $0.20 | $3.00 | $0.00279 | $27.90 |
| B | $0.60 | $1.20 | $0.00135 | $13.50 |
The calculation here is simple. With provider A, input is cheap: 450 input tokens cost only $0.00009. But 900 output tokens already cost $0.0027, and that is what eats the budget.
With provider B, the situation is the opposite. Input is more expensive - $0.00027 per conversation - but the long answer costs only $0.00108. On one conversation, the difference seems small, but at scale it grows quickly.
For a bank, this is normal. Support does not live on one conversation. If the bot handles 10,000 requests per month, option B saves $14.40 in this one scenario alone. Add disputes about payments, card reissues, and limit questions, and the gap becomes even more noticeable.
This example shows well where a cheap input price hides an expensive total bill. If the bot answers in detail, explains limits, and uses a template, look at output price first, not the lowest input rate.
Where cheap input hides an expensive total
A low price for input tokens often looks convincing on the pricing page and falls apart quickly under real load. Answer length, context size, and repeated calls almost always get involved.
A good example is summaries, reports, and long support answers. If the model gets 3,000 input tokens and returns 6,000, cheap input no longer matters much. A provider with a price of 0.1 for input and 1.2 for output can easily end up more expensive than one where input costs 0.3 and output costs 0.5.
The same thing happens with RAG agents. On paper, the request looks short, but every call adds a large context: knowledge-base excerpts, chat history, and service instructions. The user writes 30 words, but billing counts 12,000 or 20,000 input tokens. If you have thousands of such requests per day, the input rate difference is no longer a small detail.
Where spending rises quietly
Most often, it is not the prices themselves that blow up the budget, but the way billing is structured.
- A repeated call after a timeout or error can almost double the spend if the system sends the same context again.
- Rounding up to large blocks eats away the benefit of a low rate. A 1,100-token request may be billed as 2,000 or as the minimum package.
- Multimodal requests break the calculation if you look only at text. Images, audio, and video are often billed separately.
- A long chat history slowly accumulates input, even when the answers stay short.
In banking, this shows up very quickly. For example, support chat may first look up product terms through RAG, then ask the model to draft a detailed answer, and then create a short summary for the agent. One customer question turns into several calls, a long context, and noticeable output. A cheap input tariff no longer saves the day.
There is a less obvious trap too: a text pricing page does not show the price of images or audio per scenario. If a customer request includes a screenshot, a document, and a voice message, it makes no sense to count only text tokens.
That is why it is better to look not at the price of one unit, but at the cost of a finished action: a chat response, a conversation summary, or a document check. Then the comparison is fair.
Mistakes in pricing comparisons
The most common mistake is to look at the most visible line on the pricing page: the input token price. For short classifiers, that may truly be the deciding factor. But in chats, summarization, and support, output is often 2-5 times more expensive than input.
Imagine two options. In the first, input costs 0.05 per 1,000 tokens and output costs 0.40. In the second, input costs 0.12 and output costs 0.18. For a request with 300 input tokens and 900 output tokens, the first option comes to 0.375, and the second to 0.198. On the shelf, the first looked cheaper, but on the bill it is almost twice as expensive.
The second mistake is taking one neat prompt from a test and assuming it reflects real traffic. In production, people write unevenly: one person asks a question in one line, another pastes half the conversation, and another asks to rephrase the answer. One good example almost always underestimates the average cost.
People also often forget service tokens. The calculation should include the system prompt, chat history, JSON schemas, tool calls, formatting, and tokens that were or were not cached. On long sessions, this is already a noticeable amount. A 700-token system prompt across 15-20 messages can easily eat the budget if the provider has weak caching or only caches part of the request.
Another mistake is not counting the cost of failures and retries. The model may return an empty answer, break the JSON, refuse, or answer in a way that makes the application send the request again. Even 5-10% retries change the final total more than a price difference of a few cents.
And finally: do not confuse the price of the model with the price of the whole scenario. A comparison only makes sense when you measure the full business request: routing, retries, cache, moderation, and the actual average input and output size.
Quick check before choosing
Before signing a contract, it helps to run a short one-page test. If the table does not show the total for the same workload, the comparison quickly becomes confusing.
A proper table reduces all providers to one unit. It includes the price per 1M input tokens, the price per 1M output tokens, cache terms, limits, and retry costs. Otherwise, one vendor looks cheap only because it shows a price per 1K, another per 1M, and a third hides expensive output at the bottom of the pricing page.
Check five things:
- is there one table for all providers and models without mixing units;
- are both the average and worst-case scenarios calculated, not just the normal request;
- is the cost visible for 100, 1,000, and 10,000 calls;
- are limits, cache, retries, and post-error repeats included;
- can you switch models without rewriting the application logic.
The average scenario is for the monthly budget. The worst-case one is for real-world operation. In bank support, a short reply can easily turn into a long explanation about a disputed transaction, and output price immediately becomes more important than a low input rate. If this calculation is missing, the model almost certainly looks cheaper than it really is.
Numbers for 100, 1,000, and 10,000 calls quickly show where the difference stops being a small detail. At 100 requests, two providers may differ only slightly. At 10,000, the same gap turns into a noticeable cost line.
Limits and retries also change the total. If a provider often hits a rate limit, the application sends the request again, and token cost rises without adding value. The same is true for cache: a plan with a good prompt reuse rate can sometimes be cheaper, even if its base rate is a little higher.
The last check is the most practical one. The team should be able to switch models in a day, not rewrite the integration for weeks. If a provider cannot be replaced quickly, you stay with a bad tariff for longer.
What to do next
After the calculations, do not choose a model based on one line in the pricing page. Take 2-3 of your real scenarios and run them through one table: a short chat, a long answer with heavy output, and a task with repeated requests. After that, it quickly becomes clear where you are really paying.
A good working table counts not only input and output, but the whole request path: system prompt, chat history, average answer size, retries, and cache. Even a simple spreadsheet model often gives more value than a nice pricing page on the provider’s site.
Set a model replacement threshold
Do not wait until the end of the month to learn that your choice was expensive. It is better to write down a rule in advance that tells the team when to change the model or provider. For example, if the average answer consistently goes beyond 800-1,000 tokens, cheap input may no longer save the budget. If the error or retry rate grows, the final price goes up too, even with a low token rate.
It helps to keep three numbers nearby: the price of one request for each scenario, the price of 1,000 requests per week, and the threshold at which you switch to another model. Then the decision does not depend on impressions - you have a clear rule.
After that, check how easy it is for the team to switch in practice. If changing providers means editing the SDK, rewriting calls, and retesting half the service, that kind of move is rarely done on time. It is much easier when you only need to replace the base_url and keep the current code, prompts, and tools unchanged.
For teams in Kazakhstan, there is another practical filter. Check right away where the data is stored, whether audit logs exist, how PII masking works, and whether limits can be set at the key level. Otherwise, a cheap tariff can later turn into a long approval process with security and legal.
If you compare models through AI Router, this test is easier to run with the same SDKs and prompts: you only need to change the base_url to api.airouter.kz and measure the same scenario across different providers. For Kazakhstan B2B teams, you can also account for monthly invoicing in tenge and data storage requirements inside the country without building separate wrappers around each provider.