LLM Latency Budget: Where Time Goes in a Request
Learn how to break down an LLM latency budget across network, routing, model, and post-processing so you can find bottlenecks from data, not guesswork.
Why total response time explains almost nothing
Total response time tells you only one thing: the user waited a long time or got an answer quickly. That is not enough to find the cause. One number mixes network, routing, model work, and everything that happens after text generation.
Because of that, two systems with the same p95 can fail in very different ways. In the first case, the network loses hundreds of milliseconds on every call, the gateway spends time choosing a provider, and the model responds normally. In the second, the network is clean, routing is almost instant, but the model takes a long time to process the request or generate too many tokens. On a chart, that is the same p95. For the team, those are two very different problems.
The problem gets more expensive when the team fixes the wrong stage. Developers may shorten the prompt and rewrite post-processing, even though the delay sits in repeated calls to an external provider. Or the opposite happens: everyone looks at the network while seconds disappear in the model’s long output. Time is spent on debugging, and the user feels no difference.
The user does not see your internal stages at all. They notice the pause as a whole. If a chat assistant stays silent for 7 seconds, the person does not care where exactly the request got stuck. The team does care, because each part is fixed differently and at a different cost.
A single metric usually becomes misleading in four situations:
- the average looks fine, but the long tail breaks the conversation;
- p95 went up, even though the problem appeared only for some models;
- one provider slows down, but the overall dashboard hides it in the average;
- post-processing eats a second, and everyone blames the LLM API.
That is why it is better to start a latency budget with a map of stages, not with one total number. First split the request into parts, then see which part fluctuates more than the others. This is especially useful if requests go through a single OpenAI-compatible gateway: delay can appear both before and after the model.
If you do not break time down by step, p95 stays a nice-looking but almost useless number. It shows the symptom, not the point of failure.
What a request consists of
One request to an LLM is almost never one action. Between pressing a button and getting a finished answer, there are several stages, and each one takes its share of time. If you look only at the total number, latency discussions quickly turn into guesswork.
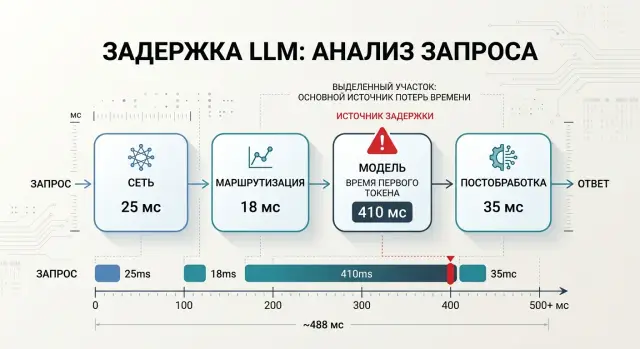
Usually, time breaks down into four parts: network, routing, model, and post-processing.
The network is the path from the client to the API and the path back. It is often underestimated. If streaming is enabled, the network affects not only response start time, but also how smoothly tokens arrive. A large prompt, a slow mobile connection, an extra TLS handshake, or a remote region can easily add noticeable hundreds of milliseconds.
Routing is more than just choosing a model by name. At this stage, the system may check rules, apply limits, choose a provider, send the request along the right path, wait in a queue, or retry after an error. Sometimes this part takes tens of milliseconds. Sometimes it takes a second if the chain becomes too complex.
The model adds two different delays. The first is time to first token, or TTFT. The second is the generation itself. For the user, those are different experiences. A fast start and a slow tail feel less painful than a long silence before the first word.
Post-processing is everything that happens after the model response: parsing, filters, JSON validation, logging, masking, formatting, and sending the result to the client. People often treat this as a minor detail, and then wonder where the extra second came from.
How to build a latency budget step by step
If you look only at the total response time, you will see a number, but not the reason. A breakdown is useful only when each stage is measured separately.
Start with timestamps in the same place for all requests. Usually, four markers are enough:
- the request entered your backend;
- the code finished checks, PII masking, and sent the call to the gateway or provider;
- the first token came from the model;
- the last token arrived, and the code finished post-processing.
From these points, it is easy to build intervals. The first shows how much time passes before the model. The second gives TTFT. The third shows generation itself. The last one covers post-processing, formatting, checks, and sending the response to the client.
The average almost always gives false comfort. Measure p50, p95, and p99 for each stage. p50 shows a normal day, p95 is closer to what users notice, and p99 quickly exposes rare but painful spikes.
Measure TTFT and total response time separately. For chat, those are two different metrics. If the first token arrives in 700 ms, the user sees a fast start even if the full answer takes 6 seconds. If TTFT suddenly grows from 800 ms to 3 seconds, look at the queue, network, or routing, not the output length.
To keep the comparison honest, hold the conditions constant. Use the same prompt set, fix the output token limit, and do not change the model, temperature, or tool calling between runs. Cold requests are also better measured separately from normal traffic.
If a chat assistant is slow, do not rush to blame the model. Sometimes the network takes 200 ms, routing takes another 150 ms, and two extra checks after the response add a full second. This kind of breakdown immediately shows what to fix first.
If your team uses AI Router, it is convenient to place markers both in the app and at the boundary of the api.airouter.kz call. That makes it easier to separate latency in your own code from latency on the route to the provider and on the model side.
What to measure on the network side
The network gets blamed first, but it is rarely the only problem. If you see 3 seconds before the first token, that is not enough. You need to understand how much time passed from the client to the gateway, and how much from the gateway to the model provider.
For an LLM feature, those are two different roads. The first depends on your app, mobile connectivity, office internet, DNS, and TLS. The second depends on where the gateway is hosted, which region the provider answers from, and how the external API behaves at that moment.
If your team works through a single gateway, do not mix these stages into one number. Otherwise, you may spend weeks trying to "fix" the provider while the real slowdown is the client connection or a repeated DNS lookup on every call.
Which metrics to write in logs
Store measurements so that you can later break each request into parts. Usually, five fields are enough:
- time from the client to the first byte of the gateway response;
- time from the gateway to the provider and back;
- whether a new TCP/TLS connection was created or an existing one was reused;
- the size of the request body and the approximate size of the response;
- the number of retries, the timeout reason, and the call region.
That is already enough to spot imbalances. For example, if the client reaches the gateway in 80 ms, but the gateway-to-provider path jumps from 300 ms to 1.8 s, the problem is not in the frontend.
Compare cold and warm connections separately. A new connection is almost always slower: DNS, TCP, TLS, and sometimes a proxy in between. Across a series of requests, the difference can be noticeable. If a warm request takes 200 ms and a cold one takes 700 ms, you did not find a "slow model"; you found the cost of missing keep-alive.
Timeouts and retries also distort the picture. One automatic retry can easily add an extra second, and in the total response time it looks like the provider simply "thought for a moment." Check who is retrying the call: the client library, your backend, or the gateway.
And do not forget the request body size. A large system prompt, a dialogue history of hundreds of kilobytes, and attachments slow transmission even before inference.
It helps to separate measurements by region and time of day. The same route can behave calmly in the morning and noticeably worse in the evening. For teams in Kazakhstan and Central Asia, this is especially important: the path to an external provider often changes more than daily averages suggest.
If the network contributes only 150–250 ms after this breakdown, do not try to squeeze a second out of it. Look дальше at routing and the model itself.
Where the model burns seconds
A model rarely has just one reason for a slow response. Usually, time is lost in four places: a long input, a too-generous output limit, waiting in the provider queue, and slow token generation.
A long system prompt seems harmless because it is written once. But the model reads it on every request. If the system section contains 2–3 pages of rules, examples, and restrictions, you can easily add hundreds of milliseconds before the first token. Sometimes more, especially with a large model and many requests.
This is easy to see in a simple example. A support chat assistant was given a 2,500-token system prompt: tone of voice, refund policy, response templates, escalation rules, and legal notes. Later, the team shortened it to 900 tokens, moved rarely used rules into a separate branch, and got a noticeably faster response without losing quality.
That is why it is better to count input and output tokens separately. Those two numbers almost always explain more than the vague idea that "the model is slow."
A large max_tokens also makes the picture worse. Even if users usually need only 120 tokens, a limit of 2000 keeps a long response tail as an allowed scenario. Some models take longer to finish a request because of that, and then the team looks only at the average time and cannot understand why the tails are so heavy.
Streaming changes the feeling of speed, but it does not always improve total response time. The user sees the first token earlier and thinks everything became fast. In reality, the model may still take just as long to finish the tail. For chat, that is often a fair trade-off. For backend tasks that need a full JSON response, it usually brings little benefit.
It is useful to look separately at TTFT, total response time, the number of input and output tokens, and queueing time at the provider. Queues are especially common during peak hours. The model itself may be fast, but the request waits 700–900 ms before generation starts. Rate limits create a similar effect: some requests slow down, some go into retries, and the graph starts to look like an "unpredictable model."
If you work through a gateway where you can switch providers and models without rewriting code, the difference is easier to see with the same prompt and the same max_tokens. In that comparison, the average matters less than the breakdown by TTFT, generation speed, and queue time. That is where you see exactly where the second disappears.
The most common mistake is simple: the team cuts network and post-processing, while the real problem sits in 1,500 extra tokens of system text or in an output limit that nobody has revisited for a long time.
A simple chatbot scenario
A bank launches a chat assistant for customers in a mobile app. The team expected a response in about 2 seconds, but logs showed the average response time had grown to 4.2 seconds. The user sees only the pause, so the developers first started cutting everything they could.
When the request was broken down by stage, the picture became simple. The network took about 250 ms, routing took 120 ms, the model itself took 3.4 s, and post-processing took another 430 ms. At that point, this was no longer an argument about feelings, but a clear stage-by-stage budget.
The developers first went after post-processing. That is a common mistake: your own code is easier to change than the prompt, conversation history, or model choice. They simplified response parsing, removed a couple of checks, and got rid of extra formatting. The gain was almost invisible because they were cutting the wrong part.
The breakdown looked like this:
- network: 250 ms;
- routing: 120 ms;
- model: 3.4 s;
- post-processing: 430 ms.
The main loss was in the model. The assistant sent a long system prompt, the full conversation history, and asked for an answer that was far too detailed every time. For a simple question about a card limit, the model received much more text than it really needed, and then generated a long answer where 4–5 short sentences would have been enough.
After that, the team barely touched the network or the code after the response. They shortened the system prompt, removed repeated instructions, started sending only the relevant messages instead of the full history, and limited the output length. Model time dropped much more than expected: from 3.4 to 1.9–2.1 seconds on similar requests.
The total response time looked much better after those changes. Not perfect, but clearly better for a live conversation. If the team had kept cutting only post-processing, it would have saved a few dozen milliseconds and lost a week. When latency is broken down by stage, it is immediately clear where to strike first and what can wait.
Common mistakes when analyzing latency
Mistakes start not in charts, but in comparing different things as if they were the same request. If you measure latency, keep the conditions identical. Otherwise, the numbers may look convincing but explain nothing.
The most common trap is simple: teams compare models using different prompts, different temperatures, and different token limits. Then they conclude that one model is "slow," even though it had a longer context and a more detailed answer. If you test through a compatible gateway and can quickly switch providers or models through the same API, that is convenient. But you should change only one parameter at a time.
Cold start also causes confusion. The first request after idle time almost always takes longer than usual. If you mix those calls with normal traffic on one chart, the average rises while the real cause stays hidden. Cold starts are better measured separately as a special operating mode.
Another mistake is looking only at the average response time. The average almost always looks calmer than the real user experience. If 80% of requests finish in 2 seconds and 20% hang for 9 seconds, the average will not show how unpleasant the tail is. Look at least at p95 and p99. That is where the problem usually hides.
There is also the old habit of blaming the network for everything. It can indeed add hundreds of milliseconds, but seconds are more often consumed by the model, especially when the response gets longer. The team sees that a request became twice as slow and immediately checks the channel, DNS, or proxy. Then it turns out the model started returning 1,200 tokens instead of 200.
It helps to quickly check four things:
- are you comparing the same prompt;
- did cold start requests get into the general sample;
- do you see p95 and p99, not just the average;
- did the response length grow along with latency.
If you answer these questions honestly, half of the "network" problems disappear before infrastructure debugging even starts.
A quick check before drawing conclusions
Before fixing latency, remove noise from the measurements. Otherwise, it is easy to blame the model when time was actually spent on retries, queueing, or extra tokens in the response. Good diagnosis starts not with charts, but with a clean comparison of identical requests.
First, lock down the test conditions. The same prompt, the same max_tokens, the same temperature, and one response format. If one measurement expects 80 tokens and another expects 800, the comparison is already broken.
Then separate the two metrics that people often mix up. The first is TTFT, or time to first token. The second is total response time. If TTFT is normal but the full response is long, the problem is often generation length, token output speed, or post-processing. If TTFT is already high, look at the network, routing, and queue before the model.
Before drawing conclusions, it helps to go through a short checklist:
- compare only identical requests with the same
max_tokens; - measure TTFT and total response time separately;
- break measurements down by provider, region, and request type;
- check retries, queues, rate limits, and internal limits;
- after each change, run a new test instead of changing everything at once.
Breaking results down by segment is a quick reality check. The same request can behave differently through different providers. For teams in Kazakhstan and Central Asia, this is especially noticeable if part of the traffic goes to an external region while part stays closer to the user. Even with an OpenAI-compatible API, latency can differ not because of the model, but because of the route.
Another common mistake is looking at the average and calming down. The average hides spikes. Take at least p50, p95, and a few raw traces for slow requests.
If the response time got better after changing the prompt, provider, or limits, verify it again on the same sample. One lucky run proves nothing. A series of 20–30 identical requests already gives you something you can work with.
What to do next
After measurements, you do not need another chart — you need a working time limit. Set a budget for each stage separately: network, routing, model response, and post-processing. As long as the team has only one number for the whole request, the discussion is almost always blind.
A good rule is simple: first set the target response for the normal scenario, then divide it into stages. For example, if a chat assistant should respond in 2.5 seconds, you might decide in advance that the network gets up to 150 ms, routing up to 100 ms, the model up to 1.8 seconds, and post-processing up to 450 ms. This is not a universal truth, but this kind of frame quickly shows where the system has already gone over budget.
Then cut the most expensive part, not the most visible one. Teams often start with what is easiest to discuss: logging, response format, small prompt edits. But if the model consistently takes 70% of the time and the network takes 5%, optimizing the network will not help much. Look at the median and the 95th percentile for each step. That is where the real losses hide.
For everyday work, a few simple rules are enough:
- keep one benchmark scenario and measure it every day;
- compare time to first token and total response time;
- check whether latency grows after changing the model or provider;
- separate business logic time from LLM API time;
- record stage-by-stage metrics in the same format for every request.
If you switch OpenAI-compatible providers, you do not have to rewrite the SDK and client code right away. It is easier to run the same requests through one compatible endpoint and change only the base_url. That makes latency comparisons fairer, because the rest of the integration stays the same. In this setup, AI Router is useful as a single gateway: you can switch routes to different providers through api.airouter.kz and see where time is really lost.
For teams in Kazakhstan, there is another practical step. If data residency and predictable latency matter, it is worth comparing external models with the open-weight models that AI Router hosts on its own GPU infrastructure inside the country. For some tasks, that removes an extra network hop and makes response time more stable.
And one last thing: do not try to fix everything at once. Find one stage that consumes the most time, fix it, and measure again by stage. After one such cycle, the picture is usually much more honest.
Frequently asked questions
Why is total response time not enough for diagnostics?
Because one number mixes everything together: network, route selection, provider queueing, model execution, and your code after the response. You see the symptom, but not which part to fix first.
Which stages should be measured in an LLM request?
Usually four timestamps are enough: the request entered your backend, your code sent the call to the gateway or provider, the first token arrived, and the last token arrived and post-processing finished. From that, you can immediately get latency before the model, TTFT, generation time, and time after the model response.
What matters more for chat: TTFT or total response time?
For chat, start with TTFT. If the first token arrives quickly, the user sees an immediate response even if the full answer takes longer.
How do you know the network is the bottleneck?
Network should be checked in parts, not with one overall number. First separate the path from the client to the gateway, then the path from the gateway to the provider, and look separately at cold connections, DNS, TLS, timeouts, and retries.
How does the prompt affect latency?
A long system prompt and extra conversation history slow the model down before the first token. The model reads that text on every request, so even a good network will not help if you send too much context.
Why limit max_tokens?
If max_tokens is too high, you allow a long response tail even where it is not needed. In practice, it is better to set a realistic limit for the scenario and check whether the output got longer without improving quality.
Does streaming make the response faster?
Streaming improves the feeling of speed because the user sees the first token sooner. But it does not always reduce total response time: the model may still take just as long to finish the full text.
Why is average time often misleading?
Average time hides the painful tails. If some requests are fine and others hang for several seconds, p95 and p99 will reveal the problem, while the average may make everything look normal.
How do you compare models or providers fairly by latency?
Use the same prompt set, keep temperature, response format, and max_tokens unchanged, and count cold requests separately. If you change several conditions at once, you are no longer comparing models or providers fairly.
How does AI Router help find where time goes?
With AI Router, you can run the same requests through one OpenAI-compatible endpoint without changing the SDK, code, or prompts. If you add timestamps in your app and at the api.airouter.kz boundary, you can quickly separate latency in your own code from latency on the route and on the model side.