Inference Autoscaling: Signals from Queue and Latency
Inference autoscaling should be based on queue length, wait time, and p95 latency so you can keep SLA during the day and avoid wasting extra GPUs at night.
Why the cluster jitters for no reason
A cluster usually jitters not because of heavy load, but because the autoscaler is bad at reading short-term changes. In the morning, traffic rises in steps: people open work services almost at the same time, the queue quickly swells, and then it falls just as fast. At night, the picture is different: there are few requests, and any single spike looks like an incident.
Because of this, inference autoscaling often mistakes noise for a new normal. The system sees a one-minute spike, brings up another GPU node, and the peak is already over. A few minutes later it decides the capacity is extra and starts shrinking the cluster again. That creates thrashing: machines come and go, while users still hit latency spikes.
At night this is even more noticeable. During the day, a queue of 30 requests may be perfectly normal for a couple of minutes. At night, the same queue looks like a reason to panic, even though it may have been caused by one batch job or one heavy prompt.
Cold GPU starts are another trap. A new instance does not help right away. It has to come up, load the model into memory, warm up containers, and join the route. While that happens, p95 latency and wait time rise. The autoscaler sees the increase and may decide there still is not enough capacity, even though the needed nodes are already starting and the system just needs time.
Another common mistake is to look only at CPU or GPU. For LLM inference, those metrics are not enough, and they often lag. The queue is already building, users are already waiting, and GPU utilization has not crossed the threshold yet because the requests have not even started processing.
Usually four things shake the cluster: a too-short metric window, the same thresholds day and night, ignoring cold starts, and relying only on CPU or GPU without considering the queue.
In banking, this is especially easy to see. At 9:00, employees mass-launch internal assistants and document search. If the autoscaler judges only by GPU load, it is late by several minutes. If it looks only at the queue over the last 30 seconds, it panics and over-expands the cluster.
A working setup does not look at one signal, but at the whole combination: how fast the queue is growing, how long a request waits before starting, and whether a new GPU will arrive before users notice the slowdown. Then the cluster stops thrashing and starts reacting for the right reasons.
Which signals to take from the queue
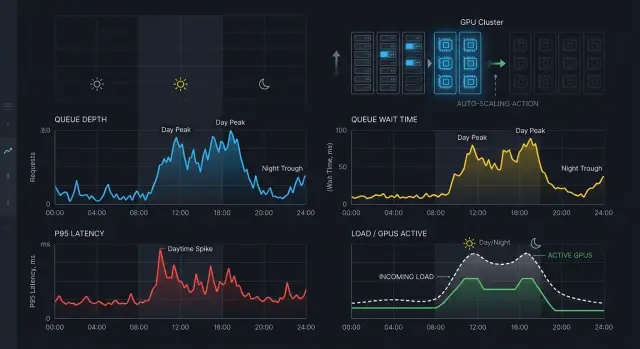
Queue length alone is almost always misleading. A queue of 20 requests may be normal at 14:00 and a problem at 14:03 if it is growing every second and the GPUs are already busy.
For inference autoscaling, it is more useful to watch not one counter, but several connected metrics. Then the cluster will not thrash because of a short spike and will not miss the moment when users are already waiting too long.
The first signal is queue depth. But by itself, it does not say much. It is much more useful to also measure the growth rate: how many requests per second are entering the queue and how many the system manages to take into work. If the queue stays at 15 and is not growing, that is fine. If it grew from 15 to 80 in a minute, it is time to react.
The second signal is wait time before inference starts. It is closer to the real user experience than raw queue length. It is better to look at p95, not the average: a calm flow easily hides slow tails, and those are the ones that hurt the SLA.
The third signal is separating requests into “in queue” and “in flight.” When there are already many in-flight requests, a new instance may be needed even with a short queue. And vice versa, a long queue sometimes appears simply because one worker took a heavy job while the others are free. Without this split, it is hard to tell where the bottleneck really is.
In practice, four metrics are usually enough:
- current queue depth
- queue growth over 30-60 seconds
- p95 wait time before inference starts
- number of requests in flight, separate from requests waiting
Another useful step is to split short and long requests into different pools. A 200-token chat and a long document-processing job should not compete for the same GPUs. Otherwise, a few heavy tasks will ruin latency for everyone else.
This is especially noticeable where part of the traffic goes to fast conversational models and part to large open-weight models on your own GPUs. If one setup includes both external models and your own GPU pools, as in AI Router, separate queues for short and long requests usually help more than bluntly scaling the whole cluster at once.
If you pick one underrated signal, it is wait time before start. The queue may still look acceptable, while users are already stuck in traffic.
How to read latency without fooling yourself
Latency is easy to misread if you look at it as a single number. The user feels the full response time, but for autoscaling that is not enough. The cluster needs to know where the time is being lost: in the queue, in the network, in the model runtime, or in request retries.
First, separate end-to-end latency from pure model time. If a request waited 1.5 seconds in the queue and the model took 400 ms, the problem is not the model. If the queue is empty but model time doubled, then the issue is no longer worker capacity, but prompt size, response length, cold starts, or a provider problem.
If traffic goes through a gateway like AI Router, this split is especially useful. The same request may pass through the API layer quickly, but sit in the GPU queue for a long time. Without breaking the path into stages, the chart will only show overall latency growth, and the team will scale the wrong thing.
The average almost always smooths out the ugly peaks. At minimum, look at p50 and p95 together. p50 shows the normal state of the system, while p95 shows the tail that breaks the SLA.
A typical pattern looks like this: p50 stays flat, while p95 climbs sharply. That is not random noise. Most often it points to local overload, a surge of long requests, or a queue that is not yet large but is already hurting the latency tail.
It is useful to keep four lines side by side: total response latency, pure model time, queue wait time, and p95 over the same minute windows.
Another mistake is mixing client errors and retries into the same graph. If the client drops the connection on the second second and then sends the same request again, the average latency and p95 start to lie. For scaling decisions, it is better to separate these events: 4xx, client cancellations, client-side timeouts, and retries.
Check latency against queue depth at the same moment, not roughly during the same period. If p95 went up and the queue did not change, look for another cause. If the queue and p95 rise together, you are short on capacity. If the queue grows but pure model time does not, you need to scale faster. If model time rises on its own, check the workload profile first, and only then add GPUs.
Which thresholds work by day and by night
The same threshold for the whole day almost always causes unnecessary swings. During the day, traffic is denser and the cost of missing is higher: the queue grows fast, p95 climbs, and users notice it immediately. At night, the same spike is often short, and if the cluster reacts just as sharply, the GPUs simply turn on and sit idle.
During the day, the scale-up threshold is usually set lower. The idea is simple: add capacity a bit earlier, before the queue becomes visible in latency. If work traffic runs from 9:00 to 19:00, it is better to react to an early rise in wait time than to wait until p95 is already beyond the SLO.
At night, the logic is different. You can raise the threshold and make the waiting window before scale-up longer. That filters out short spikes that disappear on their own. This is especially useful in banking, retail, and SaaS, where nighttime traffic includes background jobs, batch runs, and rare bursts from internal systems.
A starting setup usually looks like this:
- during the day, scale up triggers earlier if queue depth is clearly growing or wait time stays above the threshold for 2-3 minutes
- at night, the same signal must hold longer, often 5-10 minutes
- scale down needs its own timer, slower and stricter
- the threshold for reducing capacity should be lower than the threshold for growth, so nodes do not bounce back and forth
Scale up and scale down should always be separated. If you add and remove capacity on the same timer, the cluster will thrash around the boundary. In practice, reducing capacity is best done 2-4 times more slowly than increasing it. For example, you might add a GPU after 3 minutes of overload, but remove it only after 15-20 minutes of calm.
A schedule alone is not enough. First, collect at least a week of measurements for queue depth, p95, and actual GPU usage. Then split the day into windows. Otherwise, you are just locking in the wrong thresholds by schedule.
If traffic changes a lot by day of week, splitting into day and night is not enough either. Monday morning and Saturday night are different modes, and their thresholds often need to differ.
How to build an autoscaling rule step by step
A good rule starts with one SLA goal. Usually this is either request wait time in the queue or total p95 latency. Do not set two equal goals at once. Otherwise, the autoscaler will bounce around: one metric asks for more GPUs, while the other has already calmed down.
For inference autoscaling, it is convenient to split the roles like this: one metric makes the decision, and the others provide backup. For example, the team keeps wait time under 1.5 seconds, while p95 is used to check that the system really got faster and did not just move the queue somewhere else.
Then it is better to build the rule in order.
- Set the target value. Pick one number that makes sense to both the business and the engineers. For example: "95% of requests wait in the queue no longer than 1.5 seconds."
- Add an early trigger for scale up based on queue depth. It is not there because the queue itself is bad, but because it grows before p95 has time to deteriorate. If one GPU is usually safe at 8-10 active requests, set the threshold a bit below the pain zone, not at the moment of failure.
- Add a smoothing window. For most workloads, 2-5 minutes is enough. Without it, the cluster will thrash on short spikes that go away on their own.
- Add a cooldown after each resize. After scale up, give the system 3-10 minutes so new replicas can warm up, take the queue, and show the real latency. For scale down, the window is usually longer.
- Test the rule on yesterday’s traffic. Look separately at the daytime peak and the quiet hours at night. A good rule adds capacity before users notice the wait rising and does not keep extra GPUs after the load drops.
A simple working pattern is: if the queue stays above the threshold for 3 minutes in a row, add 1-2 replicas; if the queue is normal for 15 minutes and p95 is normal too, remove 1 replica. It is better to make steps small. Aggressive scaling usually costs more and is less predictable.
If different models behave differently, do not try to cover everything with one rule. A heavy reasoning model and a short chat should be scaled separately. For routes with different response lengths and different providers, the same queue depth can mean very different loads.
Example: a bank workday and a quiet night
At a bank, the morning peak usually starts not exactly at 9:00, but a few minutes earlier. Employees open internal systems, run document search, email checks, and short summaries. Traffic rises sharply, and from 9:00 to 11:00 the queue depth often grows faster than new GPUs can warm up and take traffic.
In this phase, autoscaling cannot be built only on GPU utilization. It will show the problem too late. It is better to watch a combination of three signals: queue depth, request wait time, and p95 latency. If the queue stays above the normal level for 60-90 seconds and wait time is already outside the norm, the autoscaler should add not one instance, but a small step right away.
In the morning, the rule often comes down to four things: keep a warm minimum before the shift starts, trigger scale up on a sustained queue rather than a one-off spike, add capacity in 2-3 replica steps when warm-up is long, and delay scale down until traffic settles.
After lunch, the picture changes. Requests come in more evenly, and GPU scaling should be calmer. A small buffer is useful here, one that absorbs normal fluctuations without constant on/off cycling. If the queue is almost empty and p95 is back to normal, the cluster can be reduced slowly. Haste here usually only wastes money and makes the system nervous.
At night, many teams make the same mistake: they see a rare spike and wake up the whole pool. In practice, after 22:00, one batch job for report recalculation or document labeling can cause a brief jump, but that does not mean you need to bring up the entire interactive stack. It is better to set a nighttime profile with a longer observation window.
A good nighttime scenario is simple. You ignore a rare 1-2 minute spike. If the queue lasts longer and users are truly waiting, then you add capacity. One nighttime batch is better moved into a separate queue with its own limit right away. For teams running models on their own GPU infrastructure, this is especially useful: interactive requests stay healthy, and the background job does not spin up the cluster for no reason.
Where teams most often make mistakes
Most often, teams look at one nice metric and miss the real problem. In inference autoscaling, that is usually GPU utilization. It is the first thing people notice, but it does not show how many requests are already stuck at the front or how long people are waiting for an answer.
If the queue grows before the router, batcher, or model server, the GPU may still look normal. The chart shows 55% utilization, while p95 wait time has already gone up. The user feels the waiting, not average hardware usage.
If you have an LLM gateway like AI Router, it is useful to watch not only the GPUs but also the queue at the gateway entrance. Overload there is often visible earlier than on the workers themselves.
Mistake in signal choice
One metric rarely gives the full picture. Queue depth without processing speed is misleading too: the queue may be short, but an old request is already waiting too long. Latency alone does not save you either, because it rises too late.
Usually, three signals work better together: queue depth, the age of the oldest request, and p95 wait time. That set shows both the pressure on the system and how it is already affecting the SLA.
Another common mistake is mixing interactive requests and long batch jobs in one queue. Then one heavy run ruins the metrics for chat, search, or an operator assistant.
The rule here is simple: interactive requests should go into a separate queue, batch jobs into their own worker pool, and each traffic class needs its own scaling thresholds.
Mistake in reaction time
Teams often react to a spike lasting a few seconds, even though the cold start lasts longer. A new GPU instance may take minutes to come up, not seconds. If the autoscaler pokes the cluster on every short peak, it is always chasing workload that has already passed.
The opposite mistake is just as expensive. After a short lull, teams shut instances down too quickly because the queue was empty for a minute. Five minutes later the traffic returns, and everything starts again: cold start, queue growth, latency complaints.
That is why scale out and scale in should not follow the same rules. Growing can be faster, while reducing capacity should be more careful: with an observation window, cooldown, and a minimum warm pool. It is not as flashy as aggressive savings, but the cluster stops thrashing for no reason.
Short checklist
Inference autoscaling does not break because of one bad number, but because of confusion in the basic signals. If the cluster keeps growing and shrinking without benefit, check observability first, and only then adjust thresholds.
- Keep three metrics separate: queue depth, wait time before processing starts, and pure model runtime. If you mix them into one latency number, the system will treat the wrong problem.
- Calculate p95 over a calm window, not per second. Usually a 5-10 minute window and a lower bound on request count are enough so a rare spike does not trigger extra GPU scaling.
- Scale up faster than you scale down. It is better to add new capacity after 1-2 bad windows in a row, and remove it only after a longer calm period.
- Do not use one mode for the whole day. Day and night behave differently, so thresholds or schedules should differ too.
- Show the team the cost of each unnecessary GPU start. When people see the price of extra scale-up events, they are more comfortable with a more conservative scale-down.
There is one more common trap. The team looks only at p95 latency, sees it rising, and decides that more GPUs are needed. But p95 can rise because of the front queue, a cold start, rate limits, or a slow response from an external provider. For a gateway like AI Router, it is especially useful to distinguish routing delay, queue wait time, and model time.
Night mode almost always needs separate logic. During the day, you are usually protecting user responsiveness. At night, it is more important not to keep empty GPUs running for a few rare requests. That is why nighttime setups usually use a higher scale-up threshold, a longer pause before scale down, or a fixed minimum cluster size by schedule.
If even one item from this checklist is missing, the autoscaler will almost certainly chase noise. First separate the signals, then check the windows and the cost of mistakes, and only after that change the rules.
What to do after the first settings
The first thresholds almost never last long. Inference autoscaling should be revisited with live traffic, not just one load test. Let the system run for at least a week and collect metrics by hour: queue depth, p95 latency, request wait time, GPU occupancy, and the number of cold starts.
Do not look only at averages. During the day, the queue may grow in short 5-10 minute bursts, while at night the same threshold will keep extra machines running for no reason. A clear sign of a mistake is simple: GPU scaling fires often, but user latency barely changes.
After a week, you usually see two different pictures. The first is working hours, when the flow is dense and every extra tail in the queue matters. The second is night, when there are few requests, but one long prompt or a single heavy batch can easily distort the overall picture. That is why thresholds are better kept separately for emergency growth and for nighttime idle periods.
It is useful to regularly check four things: how many requests wait longer than the target time, how p95 changes at the same queue depth, how many instances were started for no reason and got almost no load, and how often scale down is almost immediately followed by a new scale up.
Load tests are also better kept separate. Short and long prompts create different load profiles for the GPU, memory, and queue. If you mix them in one test, you get an averaged threshold that works poorly in real life. It is much more practical to run two scenarios separately and then see where the system starts missing the SLA.
Another useful habit is to write down the rules for a bad day in advance. What to do when incoming traffic spikes, how quickly to add capacity, who can temporarily raise limits, and at what level of nighttime idle time the cluster can be reduced almost to minimum. When this is not documented, the on-call team usually tweaks settings manually and only adds noise.
If your team needs a single OpenAI-compatible gateway to collect these metrics in one place and keep part of the models locally in Kazakhstan, you can look at AI Router. It is convenient when part of the traffic goes to external models and part stays on your own GPUs, and autoscaling rules need to be compared in one observability setup.