How to Use Audit Logs to Investigate Incidents in 5 Minutes
How to use audit logs for incident review: we explain which questions the log must answer within five minutes after a user complaint.
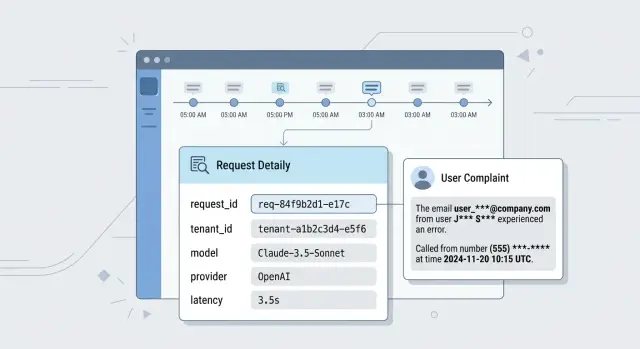
What happens after a user complaint
A complaint almost always arrives in a messy form: "the bot returned someone else's data", "the answer was weird", "the needed block disappeared". The user does not have a request_id, the model name, or the prompt version. They only have a time, a screenshot, and frustration.
Support sees the ticket first, but they usually do not have the full picture. They know the account, the rough time, and the complaint text. That is not enough. If the log does not connect the session, the user, the API key, and the exact request, the first minutes are spent searching chats, spreadsheets, and team memory by hand.
Then a developer joins and asks a few simple questions. What request actually went to the model? Which system prompt was added? Which template version was active at that moment? Which model and provider did the gateway choose? If requests go through a single LLM gateway, it is easy to mix up the model, the provider, and the call parameters without a precise trace.
This is where arguments start too early. One person is sure the old prompt was used. Another remembers that routing changed yesterday. A third thinks the cache is to blame. Without logs, the team remembers instead of checking.
So the question "how to use audit logs for incident investigation" comes down to something simpler in practice: can you reconstruct one clear request story in five minutes? If not, the incident is escalated almost immediately, while the team is still looking for traces.
Usually, several roles are involved in the review:
- support wants to understand who was affected and what to tell the user;
- the developer wants to reconstruct the exact combination of prompt, model, and parameters;
- security checks whether personal data was involved and who saw it;
- legal and compliance want a precise activity trail, not a chat summary.
Imagine a simple case: a manager says the assistant showed the wrong order number. If the audit log is set up well, the team sees the original request, the added instructions, the model response, and the next actions in the system within minutes. If there is no such trail, one incident turns into several versions of events, and each one costs time.
Which questions the log should answer immediately
After a complaint, the team usually does not have an hour for digging. A good audit log should show within five minutes whether this is a failure, a configuration issue, or a debatable model answer.
Five questions should be answered right away.
- Who sent the request. Without
user_id,tenant_id, and the API key identifier, the incident quickly turns into guesswork. In systems with multiple customers and environments, these fields immediately separate user traffic from tests and internal debugging. - When it happened. The log should store exact UTC time and a clear local representation. Otherwise, a complaint about "yesterday at 7:40 PM" can easily drift by a couple of hours together with the rest of the event chain.
- Where the request went. It is not enough to know that "the LLM" answered. You need to see the service, route, model, provider, and region. This is especially important for a gateway: after a rule change, fallback, or manual configuration edit, the request may have gone somewhere else.
- What the system sent and what it got back. You do not have to store the full text, but you do need masked input and output fragments, call parameters, attachment type, and response status. Otherwise, you cannot tell whether the model made a mistake or the system distorted the request before sending it.
- What changed shortly before the incident. If someone changed the route, limit, masking rule, or list of allowed models ten minutes before the complaint, the log should show that immediately, with the actor's name and the time.
When these answers are visible right away, the team spends time solving the problem instead of hunting for evidence.
What to write in an audit log
If the log has no identifiers, the team wastes time on guesses. Every record should answer one simple question: is this the same request or already a neighboring one?
Start with request_id and trace_id. The first helps you find a specific call. The second collects the whole chain if there are multiple services: API gateway, orchestrator, tool, database, moderation. When a user complains about one answer, trace_id often saves half the investigation.
Next to that, you need user_id, tenant_id, and the API key identifier. Then in a minute it is clear who sent the request, which organization it came from, and which access was used. This is especially important for B2B scenarios: the same model may serve dozens of teams, and confusion between tenants breaks the entire investigation.
The record should also capture which code affected the answer. The minimum set here is prompt version, response template, and the service or worker name. Without these fields, you will see the error itself, but you will not understand why the system produced that exact text. If the team changed the system prompt yesterday, the log should show it without digging through the repository.
A separate block is needed for routing. Store the model, provider, region, and route version. This is especially useful when the same request can travel different paths. If the system works through a shared gateway, the team should see not only the model name but also which provider handled the call.
The request and response text are also needed, but not in raw form. It is better to store masked input and output fragments, for example the first 200-500 characters. PII should be hidden immediately, and sensitive fields should be replaced with labels. That is enough to understand the conversation and not drag unnecessary risk into the log.
At the end of the record, keep operational fields: per-stage delay and total latency, the number of input and output tokens, tool calls with name and status, error code, and a short reason. This set answers almost all of the first questions after a complaint: who sent the request, what the system saw, where it sent it, which code ran, and which step went wrong.
How to build one event chain
When a user complains, the team is not looking for "all logs in a row" but for one request story. It should start at the entry point and end with the answer the person saw on screen or received via API.
For that, you need one request_id for the whole request path. Create it at the entry point and carry it through the gateway, routing, checks, model calls, post-processing, and response delivery. If the request goes through an OpenAI-compatible gateway like AI Router, that identifier must not get lost between your service, the gateway, and the provider.
One shared identifier is not enough if the system does retries or calls tools. Every retry should have its own retry_id, and every tool call should have its own tool_call_id. Then you can see that the first request timed out, the second went to a different model, and the third already returned an answer to the user.
The link between the user's request and the provider's response also needs to be direct, not "it roughly matched by time". In logs, it is useful to store the external provider_request_id, the model name, response status, stop reason, and timestamps at each step. Without this, the team argues about where the error was: in your code, in the router, or with the provider.
Also record every change that could have affected the result at that exact moment. If the service replaced the prompt, switched the model, enabled a different access-rule set, or applied a new masking policy, the log should show this clearly and with the change time.
Usually, five links are enough:
- a parent
request_idfor the entire chain; - child identifiers for retries and tool calls;
provider_request_idfor the external model response;- prompt version, model, and access-rule version;
- who changed the settings manually and when.
Manual actions in the dashboard often break the investigation more than code does. Someone changed an access rule at 2:03 PM, and the complaint came in at 2:07 PM. If you do not log such actions with the employee name, time, and old and new values, the team spends half an hour guessing.
A good event chain answers one question: what exactly happened to this request, step by step? If any step cannot be tied to the previous one, the investigation slows down immediately.
How to run the review in five minutes
After a complaint, you do not need to prove the exact cause right away. First you need to clear the fog: understand what happened, where it happened, and what to check next.
The first minute goes to finding one anchor identifier. The best option is the request_id from the ticket, client log, or error message. If it is missing, search by event time and user_id, but that is slower and more likely to produce false matches.
In the second minute, check the request context. Who sent it, in which tenant_id, with which API key, and at what time. A simple reason often appears here: the complaint came from one user, but the log belongs to another account, a test key, or a neighboring environment.
Then reconstruct the request route. You need four things: which service accepted the request, which model answered, which provider handled the call, and in which region it happened. For LLM systems, this is not a small detail. The same prompt can produce a different result if the router sends it to another model or backend.
What to look at in the middle of the review
Now compare the masked input and output. Do not read the log like a novel. Check whether the request matches the user's complaint, whether there were retries, whether the prompt changed after preprocessing, and whether the error happened before the model response or after it. If the user says "the assistant answered with someone else's data", look not only at the response text but also at signs of injected context.
Then open tool calls, the cache, and limits. Often the issue is not the model at all, but the system used stale cache, called the wrong tool, hit a rate limit, or repeated the request after a timeout. In a gateway like AI Router, these traces are especially useful because one request_id can pass through several routing layers.
By the fifth minute, you should have a first working theory of the cause. Not a final verdict, just a short note: "the request went through a different key", "the response came from cache", "the tool returned another user's context", "the provider returned a retry with a new result". Next to that, write the next step: disable cache, check isolation by tenant_id, pull the full trace, or ask the backend team for the raw log.
Example: the assistant answered with someone else's data
This complaint usually sounds sharp and brief: the user says the assistant showed their wrong phone number, address, or contract number. At that moment, arguing with feelings is useless. You need to quickly understand whether there was a leak, where the data came from, and what exactly broke.
LLM audit logs should connect the complaint to a specific session immediately. If the record has tenant_id, session_id, and a data source, the team quickly sees the basic picture: which environment the request ran in, which session sent it, and where the assistant got the answer from. Often the worst part is already visible at this stage. For example, the session belongs to bank A's tenant_id, but the tool returned a record from another tenant_id CRM. That is no longer "hallucination"; it is a data isolation error.
Next, look at the tool call. The log should show which search was used: vector search, SQL, CRM API, or an internal catalog. The tool name, request parameters, found record_ids, and authorization status are useful. Then the picture comes together quickly. The assistant may have received someone else's fields not because the model invented them, but because the backend returned an extra customer card after a search without a tenant_id filter.
The prompt version also changes a lot. If the team updated the tool-calling rule yesterday, that should be visible immediately. For example, if prompt_version v17 had a strict ban on answering from CRM without checking record ownership, and v18 accidentally removed that step, then the cause is no longer the model or the index, but a business-logic change.
The final check is a masked response fragment. It confirms the incident without creating a new leak. In the log, it is enough to keep a snippet like: "Your number: +7 7XX XXX 12 34, contract N ***5481". That is enough to understand that the user is right and not spread personal data across chats and tickets.
If the platform masks PII directly in audit logs, the review goes more calmly. The engineer sees the fact, the source, and the prompt version, but does not copy other people's data further along the chain.
Where teams lose time
Teams rarely lose hours on the error itself. Usually, the time is eaten by a log that answers too little. The complaint has already arrived, the user is waiting for an explanation, and engineers first try to understand what happened at all.
The most common failure is simple: the log stores only the request status and the error code. For crashes, that is sometimes enough. For complaints like "the assistant showed the wrong data" or "the answer changed sharply after yesterday's release", such a log is almost empty. A 200 status does not tell you which prompt ran, which model answered, what changed in the rules, or whether PII masking happened.
In LLM systems, confusion grows quickly if services write different times. One service writes local time, another UTC, and a third rounds seconds. Then the team looks at three records and argues about what happened first: a system prompt change, the user's request, or the model's response. One such comparison can easily take 20 minutes.
Another common gap: requests are stored separately from prompt changes, moderation rules, routing, and template versions. Then the investigation becomes a manual puzzle assembled from several systems. If the request went through a gateway, then through data masking, and then through post-processing, no one will quickly understand at which step the failure appeared without a shared event chain.
Raw texts with personal data also steal time. Such logs are scary to give to a broad team, so access is narrowed to a couple of people. Then screenshots get forwarded, data is edited manually, and everyone waits. It is safer to store masked fields and metadata instead of putting everything into the audit log as-is.
Retention period can break the review before it even starts. The user complained on Monday, support escalated on Wednesday, engineers opened the log on Thursday, and the needed records had already been deleted after 48 hours. After that, the team argues from memory instead of facts.
There is also a more down-to-earth reason: nobody owns the log schema. Every team writes fields differently, changes names without notice, and does not check record quality. A month later request_id is missing in some places, prompt version disappears from part of the requests, and one service calls the model field model while another uses provider_model. In such a log, you lose more than time. You lose confidence in the conclusions.
Incident logging checklist
A good log answers the first questions without back-and-forth between support, the ML team, and backend engineers. If the user sent the error time, request_id, or user_id, the incident should be found in a couple of searches, not through manual review of hundreds of records.
A quick check usually comes down to six points:
- the record can be found by
request_id,user_id, or an exact time window; tenant_id, API key, environment, and request source are visible;- the prompt version, model, provider, and execution route are stored;
- masked input and output are saved so the complaint can be understood without leaking PII;
- retries, cache, tool calls, and
rate limittriggers are marked; - system events are separated from manual staff actions.
The last point is often underestimated. If a support employee restarted a task, changed the prompt, disabled a tool, or temporarily raised a limit, that should live in a separate log with the person's name and the action time. Otherwise, the team argues about the model when the failure was actually caused by manual intervention.
Storing the full text is risky, and an empty log is useless. The practical compromise is simple: hide PII, but keep the request structure, service fields, text length, tool names, cache status, and the model response code.
If you cannot see at least half of these fields at this stage, user complaint review is already slowing down. That means the next incident will again have to be assembled piece by piece.
What to do next
If, after a complaint, the team is still looking for answers in chats, spreadsheets, and screenshots, the problem is not the people. The problem is that the log does not build one clear request story.
Start small: agree on one required field set and one naming scheme. Even something as simple as request_id should have the same name across all services, not requestId in one place and req_id in another. For each record, you usually need a request identifier, a safe user identifier, event time, prompt version, model, API key, response status, a manual action flag, and parent_event_id if the event continues another record.
Then take three recent complaints and run them through this schema. Measure the time to the first clear answer: what the user sent, which model handled the request, and exactly where the chain went wrong. If that takes more than five minutes, LLM audit logs are not solving the task yet.
Most often, time is lost not on complex failures, but on blind spots. Check the places where teams usually stumble:
- the time zone in the product, gateway, and storage does not match;
- retries and repeat attempts look like separate incidents;
- system prompt or template changes are not logged anywhere;
- support manual actions live outside the main chain.
Assign one person to write the first incident summary within five minutes. Not a full review, just a short note: timeline, affected users, likely cause, and what is missing in the log. This rhythm reveals weak spots faster than long discussions.
If your team works through AI Router, it is worth checking in advance that PII masking, audit logs, key-level rate limits, and data storage inside Kazakhstan are already part of the setup. For teams that care about local legal requirements and want to investigate disputed answers without manually assembling traces, these are not minor details. On airouter.kz, such a control layer can be used as part of the overall architecture, not as a separate story beside production.
Repeat the same test with three more complaints a week later. If the team can build the chain without manual searching across different systems, you are moving in the right direction. If not, add the missing field now, before the next incident makes the same gap more expensive.
Frequently asked questions
What should I do if the user only has a time and a screenshot?
Start by narrowing the time window and the account. Then search by user_id, tenant_id, session, API key identifier, and a masked text fragment. If the log is well structured, you will quickly find the right request_id and rebuild the whole chain from there.
Which fields do I need in the audit log first?
Keep request_id, trace_id, user_id, tenant_id, the API key identifier, event time, prompt version, model, provider, region, masked input and output, response status, and error code in every record. It is also useful to log latency, tokens, tool calls, and the route version right away.
Do I need to store the full request and response text?
Usually, no. For incident review, masked fragments, request structure, call parameters, and response status are enough. Store the full text only where you have strict access and a clear reason, otherwise you create extra risk for yourself.
How can I tell in a couple of minutes whether the problem is in the model or in the system?
Compare four things: what the user sent, which prompt the system added, where the router sent the request, and what the provider returned. Then check the cache, retries, and tool calls. That usually shows quickly whether the code broke, the setup is wrong, or the model itself produced the answer.
Why separate request_id, trace_id, and provider_request_id?
Because they are different points in the chain. request_id shows one user call, trace_id links all steps across services, and provider_request_id leads to the external provider's response. Without that, the team starts matching events by time and often gets it wrong.
How should I log retries and tool calls correctly?
Do not mix them into one record. Give each retry its own retry_id and each tool call its own tool_call_id, and link them to the parent request. Then it is clear where the timeout happened, which step was repeated, and which tool returned the result.
What should I check first in a complaint about someone else's data?
Look at tenant_id, session_id, the data source, the authorization status, and the found record_id first. Then check which tool returned the context and whether the tenant filter disappeared. A masked response fragment helps confirm the leak without spreading PII further.
Why can investigation still be slow even when logs exist?
Most often it is not the error itself but the schema. Time does not match across services, field names differ, manual changes are not logged, and some events live in another system. Because of that, the team cannot see one request story and spends time guessing.
How long should audit logs be kept?
Keep them for at least as long as a normal escalation path from support to engineers. If a complaint is raised two or three days later, a 48-hour retention period already breaks the investigation. In practice, it is better to keep fast access for fresh incidents and separate storage for older records.
How do I know the current logging scheme is working?
Take a few recent complaints and check whether one engineer can answer three questions in five minutes: what was sent, where the request went, and where the chain went wrong. If you still need chats, spreadsheets, and manual searching, the schema needs more work.