How to Compare LLM Model Prices Without Calculation Mistakes
How to compare LLM prices: calculate input, cache, context, retries, and response length, not just the price per million tokens.
Why price per million tokens is misleading
"Price per million tokens" is only a rough guide. It does not show how much you will actually pay in a real scenario.
The first trap is different rates for input and output. One model has cheap input but expensive output. Another is the opposite. If your service sends a short prompt and gets a long answer, the final amount changes a lot, even when the pricing pages look almost the same.
The second problem is context length. A token price alone does not tell you how much text you send before the answer starts. Chat history, system instructions, examples, retrieved document snippets - all of that is billed. In knowledge-base workflows or long contracts, context often costs more than the answer itself.
Prompt caching makes simple comparisons even less reliable. If the same instructions are repeated in thousands of requests, part of the input can be billed at a lower rate. In that case, a model with a higher base rate can sometimes produce a smaller monthly bill.
There is also a cost teams often forget: retries after errors. The model did not return JSON, hit a limit, cut off the response, or failed a quality check - so the app sends the request again. Even one extra retry for every 10-20 calls already distorts the math noticeably, especially with long context.
Because of this, two models with the same rate can produce very different bills in the same scenario. In customer support, one model may answer briefly but need more chat history. Another may read less, but write more. On paper, the price per million tokens is the same. In practice, one model will be better for short conversations, while the other will be better for complex requests.
That is why looking only at token price is a bad habit. You need to compare the cost of a typical request, including input, output, cache, context, and retries. Otherwise, the savings will stay only in the spreadsheet.
What goes into the cost of one request
One request is almost never just a simple sum of "input + output." A bill usually has several layers of text, and each one affects spending differently.
The first part is new input. This is the user message, fresh form data, a new document excerpt, or new task parameters. Providers usually bill these tokens at the full input rate.
The second part is repeated text. This often includes the system prompt, long instructions, a response template, part of the chat history, and shared RAG context that you attach again and again. If the provider supports prompt caching, the same prefix can cost less. But the discount applies only to the part that actually matches.
This is where people make mistakes most often. A team counts only the latest user message and forgets the rest of the "tail." But the model sees the whole package. If every request includes an 800-token system prompt, 1,200 tokens of history, and two knowledge-base snippets adding another 1,500 tokens, the user’s short question is no longer cheap.
The third part is output tokens. They also cost money, and for many models output is more expensive than input. This becomes obvious when you ask for not just a short reply, but a summary, table, email, SQL query, or JSON with many fields.
There is also a fourth part that teams remember too late: retries. In production, requests are restarted after a timeout, network error, empty response, or bad format. If one out of twenty calls has to be repeated, the average cost goes up by about 5%, even if token rates did not change.
In the end, the cost of a request usually comes from new input tokens, cached tokens, output tokens, and repeat calls. If you do not account for context length, cache share, and retry rate, the estimate is almost always too optimistic.
The formula that shows the real price
For practical work, the important number is not the abstract rate but the cost of one typical request. You need to account for the fact that some context is already cached, answers differ in length, and some calls have to be repeated.
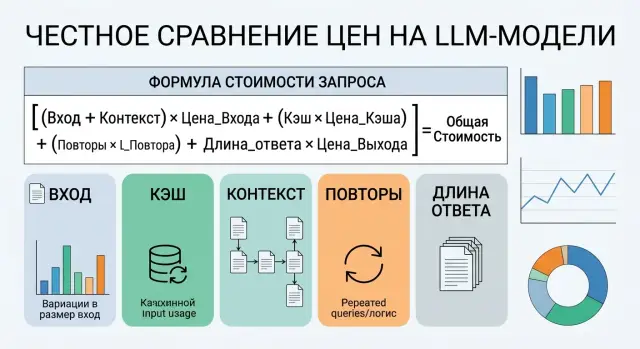
The basic formula looks like this:
Итог за запрос =
(новый ввод x ставка входа) +
(кэшированный контекст x ставка кэша) +
(ответ x ставка выхода)

Реальная средняя цена =
Итог за запрос x (1 + среднее число повторов)
By "new input," count only the tokens the model sees for the first time. By "cached context," mean the system prompt, long instructions, templates, and history if the provider bills them at a separate, lower rate. "Response" means all output tokens the model generated, even if some of that text never reached the user.
Retries are often left out of the calculation, even though they can noticeably change the final amount. If 10% of requests are sent again because of a timeout, JSON validation, or a second attempt after a bad answer, the average number of retries is 0.10 and the multiplier is 1.10. Sometimes that matters more than a few cents of difference per million tokens.
How to read the formula in practice
Suppose you have one scenario: 2,000 new tokens, 8,000 cached tokens, 700 response tokens, and 12% retries. You plug in the rates for a specific model and get not the marketing price, but the cost of one real call. Then you multiply that by your daily or monthly volume.
To make the comparison fair, keep the conditions the same: the same set of requests, the same system prompts, the same response length limits, and the same way of counting retries. Otherwise, the comparison falls apart. One model may look cheap only because you gave it a shorter context or allowed a shorter answer.
If your team tests models through a single gateway, such as AI Router, this calculation is easier: you can run the same set of requests through different models and compare not just provider rates, but the actual cost of the same workload.
How to calculate it step by step
It is better to start with real request logs, not with the pricing page. A provider’s site shows the rates, but long context, retries, cache, and response length are what really consume the budget.
Take an export for at least 7 days. A shorter period often lies: it misses rare but expensive scenarios like long conversations, response regenerations, and empty replies after an error.
First, collect three numbers for each request: new input, cached input, and response tokens. If you have retries or regenerations, mark them with a separate flag. Then calculate the cost of each call using one formula: new input × input rate + cache × cache rate + response × output rate. If the model changes pricing for long context, add that rule too.
After that, split requests into simple groups such as short, normal, and long. Too much detail rarely helps, and the team will spend too long arguing about boundaries. Then add the share of retries and empty responses. Even if the response is empty, you already paid for the input tokens, and sometimes for a repeat run as well.
It is better to calculate the cost of 1,000 requests in each group than the cost of a single call. That format quickly shows where the budget goes. A model that looks cheap by the million-token rate can lose in live traffic simply because it writes responses 1.7 times longer.
The table you need is very simple: request group, number of calls, average new input, average cache, average response, retry rate, empty-response rate, and total cost for 1,000 requests. If traffic goes through AI Router, these fields are convenient to collect in one place, but the approach works without it too.
Example from a real workflow
Imagine a bank support chat. It answers from a knowledge base: fees, limits, card blocking, transfer rules. The system prompt hardly changes, because it contains tone guidelines, restrictions, PII checks, and legal notes.
With each request, it is not only the customer’s question that grows. The chat history and retrieved knowledge-base snippets grow too. That is why context cost quickly becomes more important than it looks on the pricing page.
For an average conversation, let’s use these numbers:
- Repeated system block: 1,400 tokens. Of those, 85% are billed as prompt cache.
- History and knowledge-base snippets: 2,800 tokens per call.
- Model A: input $0.20 per 1M tokens, cache $0.05, output $1.20. It writes an average of 850 tokens and asks for clarification in 35% of cases, which means 1.35 calls per conversation.
- Model B: input $0.45, cache $0.10, output $0.80. It answers more briefly, about 450 tokens, and needs a second call only 10% of the time, which means 1.10 calls per conversation.
If you look only at the input price, Model A seems more than twice as cheap. But the full calculation tells a different story.
For Model A, one conversation comes to about 4,060 non-cached input tokens, 1,600 cached tokens, and 1,150 output tokens. That is about $0.00227 per conversation.
Model B has a higher input price, but it uses fewer output tokens and rarely needs a retry. On average, it comes to about 3,310 non-cached input tokens, 1,310 cached tokens, and 495 output tokens. That is about $0.00202 per conversation.
On a single chat, the difference is barely visible. On 100,000 conversations per month, it becomes clear: about $227 versus $202. And if Model A also sends more cases to a human operator for review, the gap gets even larger.
This example shows a simple point: first calculate the repeated system block, then the context cost, then the response length, and only after that add the chance of a second call.
Where calculations break most often
It usually starts with a metric that is too simple. A team takes the price per million input tokens, puts it into a spreadsheet, and chooses the cheapest model. Then the bill arrives, and it turns out the money was spent not on input, but on output.
That happens often in tasks where the model writes a lot: answering customers, drafting emails, or processing documents. If one model has cheap input but produces answers that are twice as long on average, comparing only input gives you almost no useful signal.
The second common mistake is forgotten context. A request price includes not only the user’s words, but also the system prompt, chat history, templates, tool schemas, and service instructions. If the system prompt is 1,200 tokens and you send it with every call, it quickly becomes a real cost item.
The average can be misleading too. Suppose in 8 out of 10 requests the model answers in 150 tokens, but in 2 cases it jumps to 2,500. On paper, the average response looks fine, but the budget is broken by the long tail. That is why it helps to look not only at the average, but also at the upper range.
Teams also often miss prompt caching. If most of the prefix repeats, such as the same system block, product catalog, or validation template, the real input cost goes down. Without cache, a model may seem expensive even though it will be cheaper in live traffic.
There is also a very basic mistake: teams change the scenario. One model is tested on short questions, another on long documents, and then the numbers are compared as if it were the same traffic. After that, any conclusion is random.
To keep the calculation from falling apart, just keep the scenario, system prompt, history length, response length limit, and cache/retry rules the same. Everything else is secondary.
When the expensive model is actually cheaper
A low input and output rate does not guarantee a low bill at the end of the month. Sometimes a model with a higher price per million tokens costs less for the same work because it answers more briefly, makes fewer mistakes, and does not force an extra turn.
The most common case is response length. One model writes 800 tokens where another uses 200 and keeps the meaning intact. If you have thousands of requests per day, the extra output cost quickly wipes out the benefit of the "cheap" plan.
There is a worse scenario too: the repeat call. If a model breaks JSON in 5-10% of cases, you are not just paying for another answer. You are sending the instruction, history, examples, and often a large context again. One extra retry can sometimes cost more than the rate difference between two models across dozens of successful requests.
The same thing happens when a model asks follow-up questions too often. On paper it may be cheap, but every clarification stretches the conversation. In customer support, document analysis, and internal copilot workflows, that hits the budget almost invisibly: input grows, output grows, and cache does not always help.
Long context is another story. A stronger model often handles a large document better, finds the right paragraph, and does not lose the constraints from the system prompt. A cheaper one may miss an important fragment, and the team starts compensating with longer instructions, repeated rules, or a second pass. On paper, the rate is lower. In practice, the spend is higher.
A small example: Model A is twice as cheap by list price, but it writes 500 more tokens on average, needs a retry in 7% of cases because of broken JSON, asks for clarification more often, and handles long context worse. In that scenario, Model B with the higher rate can easily produce a lower cost for a completed task. You need to calculate the cost of useful work, not just the token price itself.
Quick check before you choose
Before comparing models, it helps to gather one short checklist.
Write down three rates separately: for input tokens, cached tokens, and output tokens. Then count the full context: system prompt, chat history, retrieved documents, and service instructions. After that, add not only the average response length, but also the upper limit, so long answers do not disappear in the average. At the end, be sure to include the share of repeat calls: regenerations, retries, follow-up questions, and cache misses.
With cache, do not build an ideal scenario. If the system prompt and part of the history repeat, input really does cost less than new text. But cache rarely covers 100% of identical tokens. It is better to set a realistic share right away, such as 60%, than to build the calculation on a too-perfect assumption.
And one more simple rule: compare models on the same set of requests. Not on two lucky examples, not on a short demo, but on the same basket of real tasks. Only then does the price per million tokens stop being noise, and the calculation starts showing what you will actually pay.
What to do next
After all the calculations, do not choose a model based on one number in the pricing table. Take real logs for at least a week and build a comparison base: input tokens, output tokens, cache hits, context length, and request retries. Without that data, the price per million tokens almost always paints too pretty a picture.
It also helps to split traffic into three modes right away: normal, long, and problematic. The average often hides extra costs. On ordinary requests, a model may look cheap, but on long documents or retries the bill can look very different.
Keep two more numbers next to price: quality and latency. Otherwise the comparison will slip again. A model may cost 10% less, but answer 2 seconds slower or produce results the team has to edit manually. Then the token savings simply disappear.
Next, run a short pilot with 2-3 models. Take the same set of real tasks, such as ticket classification, document summarization, and knowledge-base answers. Run that set through the candidates, then compare the forecast from the formula with the actual bill. After a few hundred requests, it is usually clear where the estimate was too optimistic.
If your team tests many models through one OpenAI-compatible endpoint, AI Router helps you keep the same SDK, code, and prompts while switching providers. That makes it easier to keep one log format and one calculation method for every run.
After 7-10 days of testing, you will have not an abstract price per million tokens, but a clear cost per working request in your product. With that number, you can make a decision calmly and without self-deception.
Frequently asked questions
What should I compare besides the price per million tokens?
Look at the cost of a typical request, not just the price per million tokens. Add up new input, repeated context with cache, response length, and the share of repeated calls. That gives you the cost in a real scenario, not just a nice number from the pricing page.
What formula shows the real cost of one request?
Use this formula: (new input × input rate) + (cached context × cache rate) + (response × output rate). Then multiply the result by (1 + average number of retries) if some requests are retried or regenerated.
What counts as new input and what counts as cached context?
Treat new input as the text the model sees for the first time: the user message, fresh form fields, or a new document excerpt. Cache usually covers the system prompt, templates, part of the chat history, and any shared prefix you send again and again.
Why does long context change the final bill so much?
Context grows fast: system instructions, chat history, knowledge-base snippets, and service notes are all billed together with the user’s question. In RAG tasks or long-document workflows, context often costs more than the answer itself.
How do I account for retries, regenerations, and empty responses?
Add the average retry rate per request or the number of calls per completed workflow. If 10% of requests are sent again, multiply the price by 1.10, because you pay again for both input and output.
When does a model with a higher rate end up cheaper?
That happens when the more expensive model answers more briefly, breaks JSON less often, and doesn’t force an extra turn. In practice, it uses fewer output tokens and makes you resend the long context less often.
Is the average token count enough for the calculation?
No, an average alone is not enough. Also check the upper range for response length and context, or rare long requests will hide extra costs and break the budget forecast.
What time period is best for evaluating logs?
Use logs from at least 7 days. That period usually captures normal requests, long dialogues, format errors, and other expensive cases that a short demo will miss.
How do I compare two models fairly?
Run the same set of real tasks through both models and keep the system prompt, history, response limit, and cache rules the same. If you change any of those, the comparison stops making sense.
Will a single OpenAI-compatible gateway help compare models?
Yes, a single gateway makes testing easier because you do not have to change the SDK, code, or prompts when switching providers. For example, with AI Router you can run the same workload through different models and collect logs in one format for cost calculation.