End-to-End trace_id for LLM Requests Without Blind Spots
End-to-end trace_id for LLM requests helps tie the model response, search, tool calls, and application logs into one incident review.
Where the incident picture gets lost
A user sees one failure: the chat thinks for too long, replies with nothing, or confidently shows the wrong order status. For the person, it is one incident. Inside the system, it is already dozens of events.
Some of them land in application logs, some in the API gateway, some in search, some in tool calls, and some in the model provider. If every layer has its own identifier, the full picture falls apart. In one place it is request_id, in another chat_id, in the third tool_call_id, and somewhere the team searches only by time.
Because of this, debugging quickly turns into manual puzzle assembly. One engineer checks backend logs, another verifies the model response, and a third goes into the knowledge base search. Even a few seconds of difference gets in the way: retries, streaming, and parallel calls create several similar records, and then it is no longer clear which ones belong to the same user message.
The problem is even more visible in LLM scenarios. The answer is often assembled in pieces: the model got fragments from search, then called CRM, then switched to a fallback path after a timeout. You have the final text, but not the full route to it. You know what the system said, but not why it said that.
Usually it looks ordinary. Support brings in a complaint: “the bot said there is no data.” In the application logs there is a 500 error from an internal tool. In search logs there is an empty result. The model provider response is successful. Without a shared chain, the team starts arguing not about the cause of the failure, but about which event even belongs to this request.
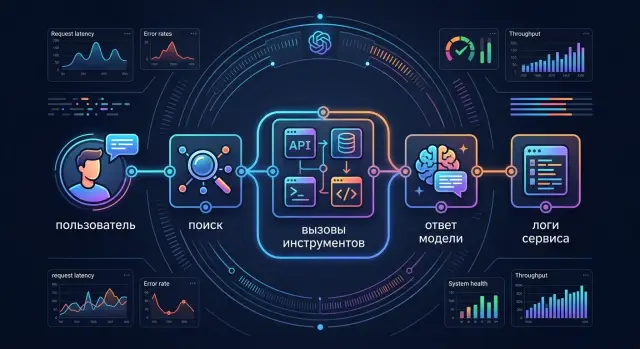
That is why an end-to-end trace_id is not needed for a pretty dashboard. It is needed to tie one user request to every step along the way: system entry, search, tool calls, model response, and the message in the interface. Then you can see where the request broke, where the system fell back to a backup path, and what the user actually saw.
What should be tied together with one identifier
One trace_id should move through the entire request path, not live only in the HTTP log. The final model response by itself is almost useless. To understand why the system failed, slowed down, or returned an empty result, you need one shared trace for every step that affected the answer.
Start with the incoming request. Here you usually need the HTTP method, route, user or service, start time, app version, and a short scenario label: chat, search, summarization, support. If trace_id appears at the entry point, you do not have to guess later which request started the chain of events.
Next comes the model call. Here it helps to link trace_id with the internal request_id and the response ID from the provider. Otherwise, when an answer is disputed, you will see the text in the interface but not find the specific call in the gateway, the model provider, or your retry queue.
A separate layer is knowledge base search. A strange answer is often not caused by the model itself, but by which documents made it into the context. That is why the same trace_id should connect the search query, its normalized form, the list of document_ids, the index version, the number of selected fragments, and the fact that the result was empty or the score was low.
The same rule works for tools. If the agent called CRM, a pricing calculator, an internal API, or an SQL function, trace_id should be written to the call record, arguments, result, and execution time. Otherwise it may look like the model “got it wrong,” when in fact the tool returned old data or received an empty parameter.
Application errors should not be stored separately either. Timeouts, retries, user cancellations, rate limit breaches, JSON parser crashes, PII masking before sending to the model — all of these are part of one incident. When these events are connected by one trace_id, debugging takes minutes: you can see which request came in, what search found, which tool behaved badly, and which response ID the provider returned.
How one request moves through the system
A user asks a question in chat, a form, or an internal portal. For the system, this is the start of one chain of events, and it is best to mark it right away, at the first entry point.
The service creates trace_id before search, before the model call, and before any rule checks. If you do it later, some events will already be written to logs without links to the rest. Then the incident falls apart into pieces: the model request is visible separately, the search separately, and the tool error separately.
After that, the app puts the same trace_id into the request context and passes it along the whole route. If you have an API gateway, an orchestrator, knowledge base search, document ranking, SQL calls, CRM, or billing, each step should receive the same identifier. In OpenTelemetry this is usually one trace with child spans, but even plain JSON logs help a lot if trace_id is the same everywhere.
A typical path looks like this:
- the interface receives the user question;
- the backend creates
trace_idand writes the entry log; - search and tools receive the same identifier;
- the model forms the answer, and the app writes the final status.
Imagine a simple case. A customer asks: why did the payment not go through. The service creates trace_id at entry. Then the search module goes to the knowledge base for refund rules, ranking selects two documents, the tool checks the transaction status in the payment system, and the LLM builds the answer for the operator or customer. If the payment service returned a timeout, you will see it in the same chain — next to the prompt, the found documents, and the model’s final text.
The final log closes the story. It usually contains trace_id, the final result, response code, model, processing time, token count, and the failure reason, if there was one. After that, debugging is not done across five different screens, but along one line of events.
If the team sends requests through a single gateway like AI Router, the logic does not change. The same trace_id should reach the call to api.airouter.kz and then come back into the application, search, and tool logs. Otherwise the chain breaks at the API boundary.
How to introduce trace_id step by step
It is better to introduce end-to-end trace_id not at the log level, but at the very first entry point. If a person clicked a button in the UI, create the identifier there. If the request comes directly to the API, create it at the gateway or in the first backend service. After that, the same trace_id must pass through the whole path: orchestrator, model call, search, tool calls, and application logs.
Usually this order is enough:
- Generate
trace_idat the first request entry. - Put it into the
request contextinside the app. - Pass it in
headersfor every internal and external call. - Write it to structured logs together with
user_id,session_id, andrequest path. - Create a separate
span_idfor each step so you can see not only the chain, but also the point of failure.
Trace_id answers one question: is it the same request or not. Span_id answers another: which step failed. That is why knowledge base search, CRM calls, model requests, and external API access should share the same trace_id, but have different span_ids.
If you already use OpenTelemetry, do not create a second identifier format. That is a common mistake. Take the trace_id that already lives in traceparent and write it to logs in the same form. Otherwise you will end up with two almost identical chains that nobody will want to merge by hand at night during an incident.
A special case is retry. If the system repeats the same request because of a timeout or 429, trace_id should not change. It is still one user request. A new span_id or a retry_count field is enough to show that this was a repeated attempt.
Another useful agreement is a shared set of headers for all services. This is especially convenient if you send LLM requests through an OpenAI-compatible gateway and want to keep your current SDKs and code without a separate tracing scheme. Then the incident reads from left to right: UI entry, search, model call, provider response, log entry in support logs.
Before launch, check three things:
- any log can be found by
trace_id; - any external call carries the same
trace_idinheaders; retrydoes not create a newtrace_idwithout a reason.
If this rule is followed from day one, debugging takes minutes, not half a day.
Which fields to write to every log
The same trace_id should live in all events that belong to one request: the incoming HTTP call, the model request, search, tools, and the user response. Next to it, write span_id so you can see not only the whole chain, but also a single step inside it.
If you have many customers and long sessions, that is not enough. Add session_id, tenant_id, and a safe hash of user_id. It is better not to store the raw user_id in logs: a hash lets you connect events from one user without bringing extra personal data into debugging.
For a model call, you almost always need the same fields: model, provider, latency_ms, input and output token usage, the provider request_id, and prompt_version. This set quickly answers the simple question: what happened and where.
If a request goes through a gateway to different providers, provider and request_id narrow the search immediately. You do not have to guess whether you hit the network, a limit, a specific model, or the wrong prompt version.
For tools and search, write separate events with the same trace_id, but with their own fields. Usually tool_name, status, error_code, retry_count, and the tool’s own latency are enough. If the tool queries search, it is useful to add the number of found documents, the data source, and a short search request identifier. Then you can see whether the model made a mistake on its own or received an empty context.
Status is better kept short and boring: ok, timeout, rate_limited, validation_error, provider_error. When teams write free text instead of an error code, debugging gets messy. One engineer looks for 429, another for too many requests, a third for quota exceeded, but it is the same case.
Do not forget the cache. The cache_hit or cache_status field often explains strange differences in latency and cost. If one answer came back in 300 ms and another in 4 seconds, the reason is often that the first hit the prompt cache and the second did not.
A good record should answer the question without reading ten neighboring lines. For example: tenant_id=bank-a, trace_id=abc123, model=gpt-4.1, provider=openai, tool_name=crm_lookup, status=timeout, retry_count=2, latency_ms=1810, prompt_version=v17, cache_hit=false. With a line like that, it is already clear where to look first.
If a field does not help you make a decision during an incident, do not put it into every log. But the fields for linking events, request route, cost, and error should always be there. They are what turn the investigation into one picture, not a pile of guesses.
How to connect search and tool calls
Problems are usually hidden not in one model response, but at the junction of steps. The model asked search, search returned the wrong documents, then a tool went to an external system with an outdated parameter, and in logs this looks like three unrelated events. One trace_id brings them together into one chain.
In retrieval, record not only the fact of the call, but also what actually affected the answer. Most often the original query, top_k, the list of document_ids, and execution time are enough. That is enough to quickly understand whether the model relied on the right documents or the search went off track.
If search returned a result from cache, write that down explicitly. Otherwise the team spends half a day looking for an index failure, when the system simply returned an old selection. The cache_hit field saves a lot of time here.
What to save for tools
For each tool call, keep the same trace_id and its own span_id. It is best to write the input parameters and the result to the log, but without unnecessary personal data. If a tool receives a phone number, IIN, or address, mask it before writing. For debugging, the structure of the request, status, error code, and a short result are almost always enough.
The minimum set for a tool looks like this:
- tool name;
- cleaned input;
- execution status;
- result or error code;
latency.
Mark external APIs separately. For each such call, create a child span, even if the call is only one step and seems simple. Then it is clear where the latency grew: in the model, in search, in CRM, in the payment service, or in your own code.
Where trace_id is often lost
The chain most often breaks in queues and background jobs. An LLM app puts a task on a queue to enrich an answer, a worker runs it, but trace_id was not passed in the payload. After that, the incident cannot be reconstructed.
Check three places:
trace_idis sent in the queuepayload;- the worker lifts it into a new span at task start;
- the background task result writes the same
trace_idto the log.
A simple example: a support bot looks up instructions, then calls an internal delivery service, and then sends the answer to the customer. If search returned document_id 184 and 221, the delivery service replied 504, and retrieval came from cache, you will see the whole chain immediately. Without a shared identifier, these would just be three separate records.
Example: debugging a support failure
A customer writes in chat: “Where is my onboarding request?” On the surface it is a normal request, but the answer went in the wrong direction because two failures happened at once. Search brought up an old case, and CRM did not return the current status in time.
Without a shared identifier, the team would only see fragments: the question text in chat, a 504 in the CRM log, and the model’s finished answer. With one trace_id, the picture comes together in a minute.
In a real investigation, the chain looked like this:
- 10:14:03 - the chat received the customer question and created a
trace_idfor the whole flow; - 10:14:04 - the search service found a record by phone number, but picked a two-month-old entry;
- 10:14:05 - the orchestrator called CRM for the latest status, but got a 504 due to timeout;
- 10:14:06 - the tool layer returned an error, and only the old record data entered the model context;
- 10:14:08 - the model replied that the request was “waiting for a response,” although in fact it had already been handed over for installation.
This kind of failure often looks like “the model made it up.” In reality, the model simply assembled an answer from what it was given. If the logs do not link search, the CRM call, and the final response, the team starts fixing the wrong thing: the prompt, the temperature, or the model choice. That is a waste of time.
One trace_id shows the order of events and gives you a basis for a decision. The log makes it clear that the error did not start with text generation, but earlier: search let an outdated record through, and CRM did not fit into the short timeout. After that, the model received incomplete context and built the answer from old data.
After the investigation, the team changed three things. First, it increased the CRM timeout to a realistic level and added one retry for 5xx responses. Then it added a freshness filter in search: old cases no longer go into the main context without an explicit label. Finally, it added a rule for the model: if the status source is unavailable, it must say directly that the status cannot be confirmed right now, instead of answering from an archived record.
The result is checked simply. If a similar incident happens again, trace_id will once more show the whole chain: the customer question, the found documents, the tool calls, the CRM errors, and the text that went into chat. Debugging will take not half a day, but 10-15 minutes.
Common mistakes
The most common problem is simple: the team thinks tracing already exists because trace_id appears somewhere in the logs. In reality, it lives in only one place and breaks at the first transition between services. Then debugging falls back to time, user, and guesswork again.
With an end-to-end trace_id, that does not work. The same identifier must pass through the incoming HTTP request, orchestrator, model call, search, tools, queue, and background job. If the chain breaks at any step, you no longer see the full route.
Where the chain breaks
The first mistake is that every microservice generates its own trace_id. Locally that is convenient, but for investigations it is useless. In the end you get five “correct” identifiers for one request, and none of them ties the whole story together.
The second mistake is writing trace_id only into API gateway access logs. There you can see that the request came in and went out, but you cannot see which prompt the orchestrator assembled, which retriever returned an empty result, or which tool failed.
The third mistake is losing the identifier in queues, webhooks, and background jobs. This is the most common weak spot: the synchronous part still looks connected, and everything that goes into async processing falls out of the picture.
Even if you use one gateway for models, that alone does not solve the problem. The gateway helps centralize model calls, but the queue, CRM webhook, and post-processing worker still have to receive the same trace_id and log it on their side.
What makes debugging harder later
Another mistake is saving tool output without the prompt version, template, or route. You see a strange model answer, but you cannot tell what changed: search, prompt, the tool set, or the model choice.
And the last miss is writing personal data into logs instead of a stable user or session identifier. That creates unnecessary risk and hardly helps diagnosis. It is much more useful to store user_id, session_id, conversation_id, and connect them to trace_id. Then event correlation in OpenTelemetry and normal logs works without manual cleanup of sensitive data.
In short, the mistake is almost always the same: the team traces not the request, but separate pieces of the system. For LLMs, that is not enough.
Quick check before launch
Before release, do not check the diagram on paper — check one live scenario. Take a request that goes through search, the model, and at least one tool. If end-to-end trace_id is set up correctly, the whole chain will come together in a couple of minutes without guesswork.
The test is simple: the user asks a question, the system goes to search, then the model calls a tool, and then one of the steps gets an error or goes into retry. This run quickly shows where the event chain breaks.
What should line up:
- one user request gets one
trace_id, and it does not change until the final response; - the logs for search, the model, the tool, and the app appear in a clear time order;
retrycreates a new span orattempt_id, but keeps the originaltrace_id;- a 5xx error immediately opens the linked prompt, tool name, and model provider;
- the on-call engineer can assemble the incident from one identifier, without searching multiple systems.
Check this on a concrete example. Suppose the support chat looks up an order in the database, then calls a tool for delivery status, and the model request goes through an external provider. If the tool step returned a 500, you should see the same trace_id in access logs, in search logs, in the tool call record, and in the LLM gateway event.
Also look closely at retries. A common mistake is simple: the first attempt writes one identifier, the second writes another, and the story falls into pieces. Then debugging again turns into time-based comparison, which is slow and annoying.
If, after the test, the engineer still asks which prompt went to the model, which tool was called, and which provider failed, it is too early to launch. First bring the logs to a state where one trace_id truly leads through the whole chain.
What to do next
End-to-end trace_id does not require a major rebuild on day one. Start with one identifier format and a short set of required fields. Usually request_id, user_id or session_id, model name, tool name, status, latency, token usage, and error code are enough. If every service writes its own set, debugging will fall apart into pieces again.
Then take one real scenario and run it end to end. A normal support conversation works well: the user asks a question in the UI, the app looks up documents, calls an internal tool, sends the request to the model, and saves the response. The goal is simple: use one trace_id to quickly reconstruct the request path from the screen to the internal system.
A minimal plan looks like this:
- agree on the
trace_idformat and the list of required fields for all services; - test one working scenario end to end, not separate steps;
- add an alert for requests where
trace_idis empty, truncated, or changes on the way; - connect application logs, tracing, search events, and tool calls into one chain.
Also check the boundary with the external LLM gateway. If you work through AI Router, it makes sense to agree right away on how to pass trace_id in a request to api.airouter.kz and how to reconcile the audit log entry with the application log afterward. This is especially useful when the team uses one OpenAI-compatible endpoint for different models and providers and does not want to lose the chain on the external call.
And one last practical check. Open any fresh request, take its trace_id, and try to answer three questions in five minutes: what the user asked, which documents or tools were involved, and exactly where the failure happened. If the team cannot do that quickly, do not add new fields. First make sure the existing ones reach the end without loss.
Frequently asked questions
Why do I need a `trace_id` if I already have logs?
Yes — without one trace_id, the team will piece together an incident by time, chat_id, request_id, and guesswork. One identifier links the incoming request, search, tools, model call, and final response into a single chain.
Where is the best place to create `trace_id`?
Create trace_id at the very first entry point: in the UI, at the gateway, or in the first backend service. If you add it later, some events will already be in logs without a link to the rest of the story.
Should `trace_id` change on a retry?
No, keep the same trace_id during a retry. It is still one user request, and you can mark the new attempt with span_id, retry_count, or attempt_id.
How is `trace_id` different from `span_id`?
Trace_id answers one simple question: is this the same request or not. Span_id shows which step in the chain caused the delay, error, or timeout.
What fields should go into every log?
Start with trace_id, span_id, session_id or a safe hash of user_id, status, latency, and error code. For model calls, add model, provider, token usage, prompt_version, and the provider request_id so the engineer can see where to look right away.
How do I avoid losing `trace_id` in queues and background jobs?
Pass the same trace_id in headers, in the queue payload, and in the background task context. The worker should pick it up at startup and write the result with it, otherwise the chain breaks at the async step.
How do I connect knowledge search and tool calls?
Write one trace_id to all search and tool events. For search, it is usually enough to log the query, document_id, top_k, index version, and cache_hit; for a tool, log the name, cleaned arguments, status, error code, and latency.
What should I do with `trace_id` if the request goes through an external LLM gateway?
Carry the same trace_id through to the external call and keep provider and the external request_id on your side. If you send the request through AI Router, the chain should continue without a break: from your app to the gateway and back into your logs.
How can I quickly check that tracing is set up correctly?
Take one live scenario with search, a model, and at least one tool, then deliberately trigger an error or retry. After that, an engineer should be able to see the user question, the found documents, the tool call, and the failure point by one trace_id.
What if the system already has `request_id`, `chat_id`, and `tool_call_id`?
Choose one format and make it the main one, usually the trace_id from OpenTelemetry or from the first entry service. Do not remove the other identifiers, but always tie them to this trace so request_id, chat_id, and tool_call_id do not live on their own.