Cold start in a self-hosted model: how to eliminate delays
A self-hosted model cold start adds extra seconds to the first request of the day. Here’s how to handle warm-up, a ready-replica pool, and a schedule without unnecessary cost.
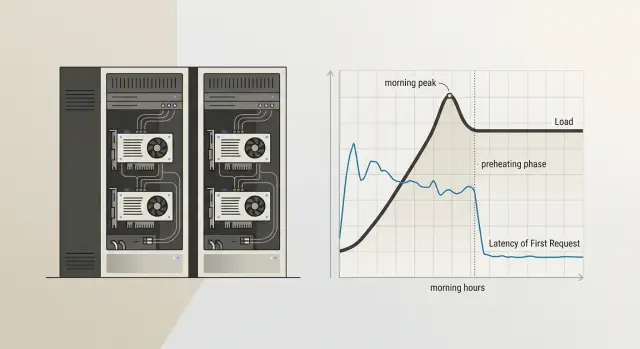
Why the first request is slow
A cold start in a self-hosted model is the pause before the first response, when the model is not yet ready to work. At that moment, the system starts the process, loads the weights into memory, occupies space on the GPU, and checks that everything came up without errors. Until these steps are complete, the user just waits.
This kind of delay usually shows up in the morning, after overnight idle time, or after a long break during the day. The reason is simple: keeping a heavy model "hot" around the clock is expensive, so unused replicas are often stopped. For teams that host open-weight models on their own GPU infrastructure to keep data inside the country, this is a normal trade-off between speed and cost.
The pause hits chats the hardest. A person writes at 9:01, sees a blank screen for 15–30 seconds, and decides the service is broken. In RAG scenarios it looks even worse: the search over the knowledge base finishes quickly, but the model response is delayed as if the problem were in the response logic itself. In internal bots for support, HR, or sales, this kind of start ruins the impression from the very first message.
There is also a second effect: people rarely wait calmly. They click the button again, refresh the page, or send the same question a second time. The server gets extra requests, and later the team starts looking for "instability," even though the cause was just one cold launch.
Sometimes there is nothing to do here. If the service is used rarely, the first request starts a background task, and users know the answer will not arrive instantly, constant warm-up only burns resources for no reason. But if people judge the service by the first second of response, cold start can no longer be dismissed as a minor detail. One morning pause often damages trust more than a rare error in the middle of the day.
What the pause is made of
The delay before the first response almost never happens in just one place. It is usually built from several stages, and each one adds its own seconds.
First, the platform brings up the process itself. If the model runs in a container, the system starts the container, connects the environment, checks dependencies, and opens access to the devices. You can already lose noticeable time here, especially if the instance was sleeping before or the node was busy with another task.
Then the server loads the model weights into memory. For a small model, this is tolerable. For a large one, it is not. The disks read the files, the process lays out the tensors, and moves them to where the model will run. If a team keeps, for example, Qwen 3 or Llama 4 on its own GPU machine, loading the weights often eats up the longest part of the wait.
After that, the GPU prepares memory for launch. The system allocates buffers, reserves VRAM, sets up the context, and checks whether there is enough space for the current model and batch size. If another task was running on the card before that, cleanup and new allocation also take time. Sometimes the model is already loaded, but the first request still waits because of this step.
Only then does the first real run begin. It is almost always slower than normal. The framework compiles parts of the graph, creates service caches, warms up kernels, and fills the structures that will speed up the next calls. That is why the second and third requests usually run much more smoothly.
That is why the delay feels strange: from the outside it is one long response, but inside several different operations have taken place. This is also why cold start cannot be fixed with a single setting. If the process starts quickly but the weights take a long time to load, arguing about caches makes no sense. If the weights are already in memory but the GPU reallocates VRAM every time, the problem is elsewhere.
How to tell it is really a cold start
If the first request in the morning takes 8–12 seconds and the following responses arrive almost immediately, that strongly suggests a cold start. But the same kind of delay can also come from other causes: queueing, network, authorization, a slow disk, or moving weights to the GPU.
Do not look at one bad call. Look at the repeated pattern. If after inactivity the first response is consistently worse than the normal flow and then the delay drops quickly, the cause is almost certainly model startup or environment warm-up.
What to measure
Break the total delay into stages. It is especially useful to track time to first token separately. If this grows after inactivity, the process, container, or the model itself was not ready to work.
Check four things:
- compare the first request after inactivity with 5–10 normal requests in a row
- measure time to first token separately from total response time
- rule out queueing, network, and authorization one by one
- record how long the service was idle before each test
The last point is often skipped. Without idle time, the picture gets blurry: a pause after 3 minutes and after 2 hours has a different effect. It is better to agree on a simple rule right away and test, for example, after 15, 30, and 60 minutes without traffic.
A good test is to send the same short prompt under identical conditions. First after an hour of silence, then again 10 seconds later, then as a series of several requests. If the first call is slow, the second is much faster, and there is no queue and the network is stable, you have found the source.
Sometimes the model startup is not the real culprit, but an outer layer is. Authorization can slow down on the first request because a session is being refreshed. A network proxy may keep a "sleepy" connection open. A task queue may accumulate background jobs. That is why it is useful to look at timings by stage, not just the final number.
In production, this is usually visible in the logs. On the first request after inactivity, the worker initialization time, weight loading, or CUDA warm-up increases. In the normal flow, these stages almost disappear. If that is the pattern, you need to fix model startup, not the prompt or the network.
How to set up warm-up step by step
Warm-up is not there for show. Its job is simple: make sure the first live request in the morning or after a restart does not wait for weight loading, memory initialization, and the startup of the needed processes.
The most common mistake is to warm the model with a request that does not resemble real work. The background calls keep running, but the first delay barely changes.
- Choose a short and cheap request. It should follow the same path as a normal one: the same model, the same parameters, the same response format. In practice, a short prompt of 10–20 tokens with an answer like "ok" is often enough.
- Start warm-up right after deployment and after any restart. Do not wait for the first user. If the container was rebuilt, the node restarted, or the instance came back up, send the warm-up request automatically.
- Add a schedule that matches the team’s working rhythm. If the service is used from 9:00, start warming it 10–15 minutes before that. This uses fewer resources than running it hot all the time and removes the pause exactly when it is most annoying.
- Look not at whether a response came back, but at the first delay. If the request returned, that does not yet mean the setup worked. Compare the time of the first real response before and after warm-up.
- Turn warm-up off where it makes no difference. Some models stay in memory anyway, and some services receive requests around the clock. In that case, background calls only waste money and take up queue time.
A good example is an internal support chat used by employees from 9:00 to 18:00. After overnight idle time, the model often falls asleep. A simple schedule at 8:45 and warm-up after each restart usually solves the problem without keeping a pool of ready replicas hot all the time.
When you need a pool of ready replicas
A pool of ready replicas is needed when warming one replica is no longer enough. If the service gets not one request in the morning but a whole batch, the first hot replica only serves one user, and the rest wait for the next one to start. That is how cold start appears again, even though it was already addressed, and it still hits the first minutes of work.
One hot replica is usually enough for rare requests and internal tools for a small team. But if you have a morning spike, operator shifts, a mass employee login, or scheduled background jobs, one replica is not enough. In that case it is better to keep at least one copy ready at all times and bring up a second one only during the hours when the spike repeats almost every day.
A simple rule of thumb: if a queue appears already on the first 2–3 simultaneous requests after inactivity, it is time to build a pool. This is especially visible with heavy open-weight models that occupy GPU memory for a long time and do not handle sudden spikes well.
These are usually signs that a pool is needed:
- the first user gets a quick response, but the second and third become much slower
- the delay grows only at the start of the working day
- the GPU sits idle for half a day but cannot handle the morning spike in time
- after a restart or overnight idle time, the service takes a long time to return to normal
Do not keep the same minimum number of replicas all day. That is an expensive habit. It is much more sensible to change the number of ready copies by the hour: one at night, two in the morning, then one again during the day if traffic falls. This usually gives almost the same response time as a permanent reserve, but without extra GPU costs.
Another common mistake is putting heavy and light models on the same GPU without memory headroom. A large model can take up almost all VRAM, and then a light replica either will not start on time or will begin pushing out its neighbors. It is easier to separate them onto different GPUs or at least not mix models with very different sizes in the same pool.
If the team works on its own GPU infrastructure and keeps several open-weight models, you need to watch memory as well, not just latency. A pool does not break when ideas run out. It breaks when a replica cannot fit into VRAM at the right moment.
How to build a schedule without guessing
It is better to build a warm-up schedule from logs, not from the team’s feelings. Intuition often fails here: everyone thinks the rush starts at 9:00, but in reality the first heavy wave begins at 8:37 and lasts only 18 minutes.
Take logs for at least 2–4 weeks. If traffic depends on reporting dates, payroll days, or mailing campaigns, look at a longer period. You need not only averages, but also the shape of the load by hour: when the model is idle, when it wakes up, and when requests rise sharply.
It helps to mark a few points:
- the first request after a long idle period
- the hours with the longest pause between requests
- short spikes where the queue grows in 5–15 minutes
- the difference between weekdays and weekends
- days after releases or mailings
Then build warm-up not at the peak itself, but a little earlier. If traffic usually rises by 9:00, warm the model at 8:45 or 8:50. If you do it at 9:00, users will already hit the first delay. If you warm it too early, you simply waste GPU time without any benefit.
One common weekly schedule rarely works well. Many services have a morning start on weekdays, while on weekends traffic comes later and is lighter. So it is better to keep two schedules: one for working days and one for Saturday and Sunday. Sometimes you need a third, if Monday is clearly different from the other days.
A simple example: an internal support assistant is almost silent at night, wakes up at 8:40, and then gets a second spike after lunch. In that case, it makes sense to set a short warm-up before the shift starts and another one before the afternoon peak, instead of keeping a copy hot all day.
And one more thing: the schedule cannot be considered final forever. After a release, a prompt change, a new channel, or user growth, traffic changes quickly. Check the plan against the logs every couple of weeks. If the first delay starts creeping up again, the schedule is already outdated.
A simple example for one service
In support, the morning often ruins the whole picture. At night the model is barely used, and at 9:00 both agents and customers arrive at once. If the team runs an LLM on its own GPUs, the first response can easily take 15–20 seconds, even though everything runs much faster afterward.
The team did not want to keep extra replicas hot all day. For their traffic pattern, that was simply too expensive. Instead, they looked at the request history and saw a clear rhythm: a sharp spike in the morning and then a calmer period after lunch.
The setup was simple:
- at 8:45 the system sends a short service request and warms one replica
- from 9:00 to 11:00 the service keeps a second hot replica so the queue does not grow
- after lunch the service returns to one replica when traffic drops
The warm-up request itself is very short. Something like: "Answer with one word: ok". That is enough to load the weights, occupy GPU memory, and check that the model responds without error. A long test dialog is not needed here.
A week later, the team compared the numbers. Before the change, the first morning response sometimes took more than 18 seconds. After warm-up and the second hot replica during the peak, most first responses were down to 2–4 seconds. Users almost stopped complaining about the pause, and agents no longer had to wait for the assistant to "wake up."
GPU usage did rise, of course. But not as much as they feared. The extra replica was active only for two hours in the morning, not all day. So the team looked not at abstract savings, but at two clear numbers: how many GPU hours the schedule added and how many seconds it removed from the first delay.
Where teams make mistakes most often
The most common mistake is simple: the team turns on warm-up when users have already started sending requests. If people arrive at 9:00 and the job starts at 9:00, the first wave still hits the pause. It is better to look at real traffic hours and start warm-up in advance, often 10–20 minutes before the peak.
The second mistake costs money. The team warms all models the same way, as if they had the same size, the same stack, and the same loading speed. But a small model and a heavy self-hosted model behave differently: one only needs a short request, while the other needs to load weights, adapters, a prompt template, and part of the cache.
Another common mistake is an overly heavy test prompt. The team wants to "definitely warm up" the model and sends a long request with thousands of tokens. In the end, it creates extra load, clogs the queue, and ruins the metrics. For warm-up, a short and stable request is usually enough to bring up the process, load the tokenizer, and check the basic response path.
Problems often come back after restarts. The node rebooted, the driver was updated, the orchestrator rebuilt the pods, the container moved to another GPU — and the morning warm-up no longer helps. If the team only watches the start of the day, it misses delays that appear in the middle of a shift.
Usually it is worth checking the following:
- exactly when warm-up starts relative to live traffic
- which models really get a separate warm-up scenario
- how heavy the test request is
- what happens after a node or container restart
- what tails show up in p95 and p99
Average response time almost always gives a false sense of calm. If nine requests answer in 2 seconds and the tenth takes 25, the average looks acceptable, but the user is still annoyed. Look separately at the first delay, the tail, and the behavior after a restart.
This is especially noticeable in teams with multiple model routes. Even if external access goes through a single gateway, mistakes in warm-up of self-hosted copies do not disappear. You only see them where the team measures not the "average temperature," but the first response in a real scenario.
A quick check before launch
Teams often look at latency right after a manual test and think everything is fine. Then an hour of inactivity passes, the first live request arrives, and the response jumps to 8–20 seconds. This kind of failure is easy to miss if you only test the "warm" state.
Before launch, it is useful to run a short test that shows the real first delay, not a nice number from a staging setup.
What to check in 15 minutes
- stop traffic to a test copy and measure the first request after 30, 60, and 120 minutes of inactivity
- repeat the same test after deployment and after an emergency restart, when the container or process comes up from zero
- use a normal-sized prompt, not a short 20-word line
- check the request route: the load balancer or orchestrator should send the first request to an already warmed copy, not to a fresh instance
- compare the cost of hot replicas with the delay you need
A simple example: a support service keeps the model idle overnight. In the morning, an agent opens the chat, sends a long request with conversation history, and gets a response in 14 seconds. The team turns on warm-up every 45 minutes, keeps one ready replica from 8:00 to 11:00, and gets first responses in 2–3 seconds. The difference is obvious, and it is easy to explain to the business in money terms.
Also check that the metrics do not mix the first request with the rest. If the average latency looks good but the first request after inactivity is still slow, that average does little for the user.
If the first delay is still above target after this check, do not rush to add more hardware. First make sure the warm-up schedule matches real traffic and that the pool of ready replicas comes on at the right hours, not just formally.
Where to start next
Do not try to fix the whole model fleet at once. Take one model whose first response drops most often in the morning. Usually that is enough to quickly see where you are losing time and money.
A good first candidate is a model with a clear peak at the start of the working day. If employees start sending requests from 9:00 to 10:00 and the first response during that window is noticeably slower than usual, you already have a clear point to check.
Start with a simple plan:
- add a light warm-up 10–15 minutes before the expected peak
- keep at least one hot replica for that model
- measure the first delay separately from the daily average
- see how much GPU time this mode consumes
Do not overcomplicate the setup on day one. One scheduled warm-up and one ready replica already give enough data. If the effect is weak, then it makes sense to change the warm-up frequency, the pool size, or the activity window.
After a week, compare two things: how the delay on the very first morning request changed and how much GPU usage increased. If the first delay dropped, for example, from 18 seconds to 3–4 seconds and the extra cost stayed moderate, the setup paid off. If GPU usage is too high, move the schedule closer to the real peak or shorten the time the hot replica sits idle.
If the team needs a single OpenAI-compatible endpoint for working with different models, and at the same time values hosting open-weight models in Kazakhstan, audit logs, and data storage inside the country, AI Router is worth a look. The service at airouter.kz provides one compatible API gateway for 500+ models from 68+ providers and its own hosting for 20+ open-weight models, so this option can simplify the setup without changing your SDK or prompts.
After that, it is all pretty practical: pick one problematic model, warm it up before the morning peak, and check the numbers again in a week. That is usually how the most noticeable pause gets removed without unnecessary spending.
Frequently asked questions
What is a model cold start?
Cold start is the pause before the first response, while the service spins up the process, loads the model weights into memory, and prepares the GPU. Because of that, the first request after inactivity often takes much longer than the rest.
When is a cold start not worth fixing?
If the service is used rarely and people are willing to wait, constant warm-up is usually not necessary. In that case, it is better to accept a pause on the first request than to keep the GPU busy all day for nothing.
How can I tell that cold start is the real cause?
Look for a repeating pattern, not a single slow request. If the first response after 30–60 minutes of silence is consistently slow and the next one is almost normal, the problem is very likely in model startup or environment warm-up.
What should I measure first?
Start with time to first token and compare it for the first and second request. Then check network, authorization, and queue separately so you do not look for the cause in the wrong place.
What should a warm-up request look like?
Use a short, cheap prompt that follows the same path as a normal request. Often a phrase like Reply with one word: ok is enough if it launches the same model, the same parameters, and the same response format.
When is one warm-up no longer enough?
One warm-up is not enough when several people arrive at once in the morning. If the first ready replica answers quickly for only one user and the second and third have to wait for a new one to start, it is time to keep a small pool ready.
How many warm replicas should I keep in the morning?
Start with one ready replica and check whether a queue appears on the first simultaneous requests. If it grows already at 2–3 requests after inactivity, add a second replica only during the morning peak, not for the whole day.
How do I set a warm-up schedule without guessing?
Base it on logs from several weeks, not on the team’s impression. Warm-up is best scheduled 10–15 minutes before the real spike, otherwise users will still hit the first pause.
Why should I not look only at average latency?
Averages hide the ugly tail. Nine fast responses can easily mask one slow start, even though that is the one the user will remember as a service failure.
What should I do if the delay comes back after a restart?
Check that the service sends warm-up right after the restart and that the load balancer sends the first live request to an already ready replica. If the pause remains, look at the logs for container startup, weight loading, and VRAM allocation — the problem is usually in one of those steps.